Table of Content
CHAPTER NO. 1 : INTRODUCTION 31
1.1.1. Report Description 31
Purpose of the Report 31
USP & Key Offerings 31
1.1.2. Key Benefits for Stakeholders 31
1.1.3. Target Audience 32
1.1.4. Report Scope 32
1.1.5. Regional Scope 33
CHAPTER NO. 2 : EXECUTIVE SUMMARY 34
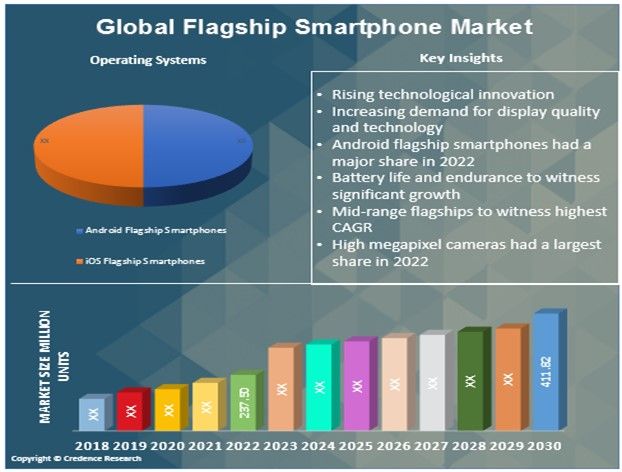
2.1. Flagship Smartphone Market Snapshot 34
2.1.1. Global Flagship Smartphone Market, 2018 – 2032 (Units) (USD Million) 36
2.2. Insights from Primary Respondents 37
CHAPTER NO. 3 : GEOPOLITICAL CRISIS IMPACT ANALYSIS 38
3.1. Russia-Ukraine and Israel-Palestine War Impacts 38
CHAPTER NO. 4 : FLAGSHIP SMARTPHONE MARKET – INDUSTRY ANALYSIS 39
4.1. Introduction 39
4.2. Market Drivers 40
4.2.1. Driving Factor 1 Analysis 40
4.2.2. Driving Factor 2 Analysis 41
4.3. Market Restraints 42
4.3.1. Restraining Factor Analysis 42
4.4. Market Opportunities 43
4.4.1. Market Opportunity Analysis 43
4.5. Porter’s Five Forces Analysis 44
CHAPTER NO. 5 : ANALYSIS COMPETITIVE LANDSCAPE 45
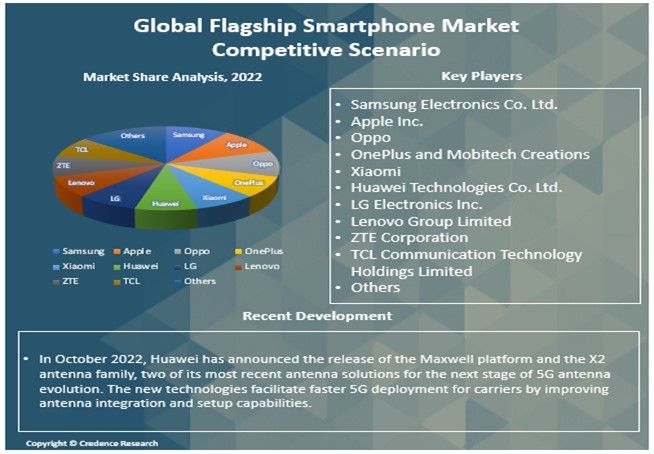
5.1. Company Market Share Analysis – 2023 45
5.1.1. Global Flagship Smartphone Market: Company Market Share, by Volume, 2023 45
5.1.2. Global Flagship Smartphone Market: Company Market Share, by Revenue, 2023 46
5.1.3. Global Flagship Smartphone Market: Top 6 Company Market Share, by Revenue, 2023 46
5.1.4. Global Flagship Smartphone Market: Top 3 Company Market Share, by Revenue, 2023 47
5.2. Global Flagship Smartphone Market Company Volume Market Share, 2023 48
5.3. Global Flagship Smartphone Market Company Revenue Market Share, 2023 49
5.4. Company Assessment Metrics, 2023 50
5.4.1. Stars 50
5.4.2. Emerging Leaders 50
5.4.3. Pervasive Players 50
5.4.4. Participants 50
5.5. Start-ups /SMEs Assessment Metrics, 2023 50
5.5.1. Progressive Companies 50
5.5.2. Responsive Companies 50
5.5.3. Dynamic Companies 50
5.5.4. Starting Blocks 50
5.6. Strategic Developments 51
5.6.1. Acquisitions & Mergers 51
New Product Launch 51
Regional Expansion 51
5.7. Key Players Product Matrix 52
CHAPTER NO. 6 : PESTEL & ADJACENT MARKET ANALYSIS 53
6.1. PESTEL 53
6.1.1. Political Factors 53
6.1.2. Economic Factors 53
6.1.3. Social Factors 53
6.1.4. Technological Factors 53
6.1.5. Environmental Factors 53
6.1.6. Legal Factors 53
6.2. Adjacent Market Analysis 53
CHAPTER NO. 7 : FLAGSHIP SMARTPHONE MARKET – BY OPERATING SYSTEMS SEGMENT ANALYSIS 54
7.1. Flagship Smartphone Market Overview, by Operating Systems Segment 54
7.1.1. Flagship Smartphone Market Volume Share, By Operating Systems, 2023 & 2032 55
7.1.2. Flagship Smartphone Market Revenue Share, By Operating Systems, 2023 & 2032 55
7.1.3. Flagship Smartphone Market Attractiveness Analysis, By Operating Systems 56
7.1.4. Incremental Revenue Growth Opportunity, by Operating Systems, 2024 – 2032 56
7.1.5. Flagship Smartphone Market Revenue, By Operating Systems, 2018, 2023, 2027 & 2032 57
7.2. Android Flagship Smartphones 58
7.2.1. Global Android Flagship Smartphones Flagship Smartphone Market Volume & Revenue, By Region, 2018 – 2023 (Units) (USD Million) 59
7.2.2. Global Android Flagship Smartphones Flagship Smartphone Market Volume & Revenue, By Region, 2024 – 2032 (Units) (USD Million) 59
7.3. iOS Flagship Smartphones 60
7.3.1. Global iOS Flagship Smartphones Flagship Smartphone Market Volume & Revenue, By Region, 2018 – 2023 (Units) (USD Million) 61
7.3.2. Global iOS Flagship Smartphones Flagship Smartphone Market Volume & Revenue, By Region, 2024 – 2032 (Units) (USD Million) 61
CHAPTER NO. 8 : FLAGSHIP SMARTPHONE MARKET – BY SPECIFICATIONS AND PERFORMANCE SEGMENT ANALYSIS 62
8.1. Flagship Smartphone Market Overview, by Specifications and Performance Segment 62
8.1.1. Flagship Smartphone Market Volume Share, By Specifications and Performance, 2023 & 2032 63
8.1.2. Flagship Smartphone Market Revenue Share, By Specifications and Performance, 2023 & 2032 63
8.1.3. Flagship Smartphone Market Attractiveness Analysis, By Specifications and Performance 64
8.1.4. Incremental Revenue Growth Opportunity, by Specifications and Performance, 2024 – 2032 64
8.1.5. Flagship Smartphone Market Revenue, By Specifications and Performance, 2018, 2023, 2027 & 2032 65
8.2. Camera-Centric Flagships 66
8.2.1. Global Camera-Centric Flagships Flagship Smartphone Market Volume & Revenue, By Region, 2018 – 2023 (Units) (USD Million) 67
8.2.2. Global Camera-Centric Flagships Flagship Smartphone Market Volume & Revenue, By Region, 2024 – 2032 (Units) (USD Million) 67
8.3. Performance Powerhouses 68
8.3.1. Global Performance Powerhouses Flagship Smartphone Market Volume & Revenue, By Region, 2018 – 2023 (Units) (USD Million) 69
8.3.2. Global Performance Powerhouses Flagship Smartphone Market Volume & Revenue, By Region, 2024 – 2032 (Units) (USD Million) 69
8.4. Multimedia and Entertainment 70
8.5. Global Multimedia and Entertainment Flagship Smartphone Market Volume & Revenue, By Region, 2018 – 2023 (Units) (USD Million) 71
8.6. Global Multimedia and Entertainment Flagship Smartphone Market Volume & Revenue, By Region, 2024 – 2032 (Units) (USD Million) 71
8.7. Battery Life and Endurance 72
8.7.1. Global Battery Life and Endurance Flagship Smartphone Market Volume & Revenue, By Region, 2018 – 2023 (Units) (USD Million) 73
8.7.2. Global Battery Life and Endurance Flagship Smartphone Market Volume & Revenue, By Region, 2024 – 2032 (Units) (USD Million) 73
8.8. Innovative Features 74
8.8.1. Global Innovative Features Flagship Smartphone Market Volume & Revenue, By Region, 2018 – 2023 (Units) (USD Million) 75
8.8.2. Global Innovative Features Flagship Smartphone Market Volume & Revenue, By Region, 2024 – 2032 (Units) (USD Million) 75
CHAPTER NO. 9 : FLAGSHIP SMARTPHONE MARKET – BY PRICE TIERS SEGMENT ANALYSIS 76
9.1. Flagship Smartphone Market Overview, by Price Tiers Segment 76
9.1.1. Flagship Smartphone Market Volume Share, By Price Tiers, 2023 & 2032 77
9.1.2. Flagship Smartphone Market Revenue Share, By Price Tiers, 2023 & 2032 77
9.1.3. Flagship Smartphone Market Attractiveness Analysis, By Price Tiers 78
9.1.4. Incremental Revenue Growth Opportunity, by Price Tiers, 2024 – 2032 78
9.1.5. Flagship Smartphone Market Revenue, By Price Tiers, 2018, 2023, 2027 & 2032 79
9.2. Ultra-Premium Flagships 80
9.2.1. Global Ultra-Premium Flagships Flagship Smartphone Market Volume & Revenue, By Region, 2018 – 2023 (Units) (USD Million) 81
9.2.2. Global Ultra-Premium Flagships Flagship Smartphone Market Volume & Revenue, By Region, 2024 – 2032 (Units) (USD Million) 81
9.3. Mid-Range Flagships 82
9.3.1. Global Mid-Range Flagships Flagship Smartphone Market Volume & Revenue, By Region, 2018 – 2023 (Units) (USD Million) 83
9.3.2. Global Mid-Range Flagships Flagship Smartphone Market Volume & Revenue, By Region, 2024 – 2032 (Units) (USD Million) 83
9.4. Budget Flagships 84
9.5. Global Budget Flagships Flagship Smartphone Market Volume & Revenue, By Region, 2018 – 2023 (Units) (USD Million) 85
9.6. Global Budget Flagships Flagship Smartphone Market Volume & Revenue, By Region, 2024 – 2032 (Units) (USD Million) 85
CHAPTER NO. 10 : FLAGSHIP SMARTPHONE MARKET – BY CAMERA FEATURES SEGMENT ANALYSIS 86
10.1. Flagship Smartphone Market Overview, by Camera Features Segment 86
10.1.1. Flagship Smartphone Market Volume Share, By Camera Features, 2023 & 2032 87
10.1.2. Flagship Smartphone Market Revenue Share, By Camera Features, 2023 & 2032 87
10.1.3. Flagship Smartphone Market Attractiveness Analysis, By Camera Features 88
10.1.4. Incremental Revenue Growth Opportunity, by Camera Features, 2024 – 2032 88
10.1.5. Flagship Smartphone Market Revenue, By Camera Features, 2018, 2023, 2027 & 2032 89
10.2. High Megapixel Cameras 90
10.2.1. Global High Megapixel Cameras Flagship Smartphone Market Volume & Revenue, By Region, 2018 – 2023 (Units) (USD Million) 91
10.2.2. Global High Megapixel Cameras Flagship Smartphone Market Volume & Revenue, By Region, 2024 – 2032 (Units) (USD Million) 91
10.3. Camera Array Flagships 92
10.3.1. Global Camera Array Flagships Flagship Smartphone Market Volume & Revenue, By Region, 2018 – 2023 (Units) (USD Million) 93
10.3.2. Global Camera Array Flagships Flagship Smartphone Market Volume & Revenue, By Region, 2024 – 2032 (Units) (USD Million) 93
10.4. Night Mode and Low-Light Performance 94
10.5. Global Night Mode and Low-Light Performance Flagship Smartphone Market Volume & Revenue, By Region, 2018 – 2023 (Units) (USD Million) 95
10.6. Global Night Mode and Low-Light Performance Flagship Smartphone Market Volume & Revenue, By Region, 2024 – 2032 (Units) (USD Million) 95
10.7. Videography Flagships 96
10.7.1. Global Videography Flagships Flagship Smartphone Market Volume & Revenue, By Region, 2018 – 2023 (Units) (USD Million) 97
10.7.2. Global Videography Flagships Flagship Smartphone Market Volume & Revenue, By Region, 2024 – 2032 (Units) (USD Million) 97
CHAPTER NO. 11 : FLAGSHIP SMARTPHONE MARKET – BY DISPLAY TECHNOLOGIES SEGMENT ANALYSIS 98
11.1. Flagship Smartphone Market Overview, by Display Technologies Segment 98
11.1.1. Flagship Smartphone Market Volume Share, By Distribution Channel, 2023 & 2032 99
11.1.2. Flagship Smartphone Market Revenue Share, By Distribution Channel, 2023 & 2032 99
11.1.3. Flagship Smartphone Market Attractiveness Analysis, By Distribution Channel 100
11.1.4. Incremental Revenue Growth Opportunity, by Distribution Channel, 2024 – 2032 100
11.1.5. Flagship Smartphone Market Revenue, By Distribution Channel, 2018, 2023, 2027 & 2032 101
11.2. OLED and AMOLED Displays 102
11.2.1. Global OLED and AMOLED Displays Flagship Smartphone Market Volume & Revenue, By Region, 2018 – 2023 (Units) (USD Million) 103
11.2.2. Global OLED and AMOLED Displays Flagship Smartphone Market Volume & Revenue, By Region, 2024 – 2032 (Units) (USD Million) 104
11.3. High Refresh Rate Displays 105
11.3.1. Global High Refresh Rate Displays Flagship Smartphone Market Volume & Revenue, By Region, 2018 – 2023 (Units) (USD Million) 106
11.3.2. Global High Refresh Rate Displays Flagship Smartphone Market Volume & Revenue, By Region, 2024 – 2032 (Units) (USD Million) 107
11.4. Foldable Flagships 108
11.5. Global Foldable Flagships Flagship Smartphone Market Volume & Revenue, By Region, 2018 – 2023 (Units) (USD Million) 109
11.6. Global Foldable Flagships Flagship Smartphone Market Volume & Revenue, By Region, 2024 – 2032 (Units) (USD Million) 110
CHAPTER NO. 12 : FLAGSHIP SMARTPHONE MARKET – REGIONAL ANALYSIS 111
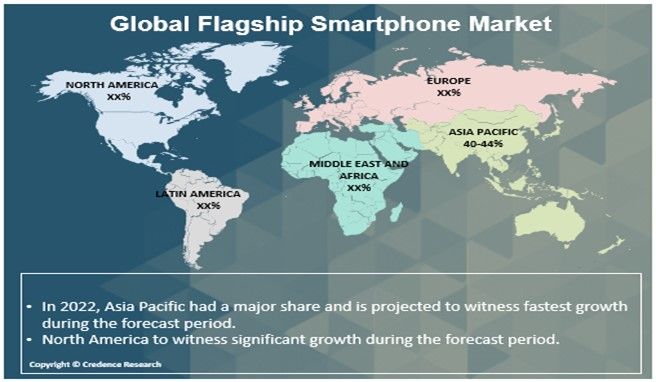
12.1. Flagship Smartphone Market Overview, by Regional Segments 111
12.2. Region 112
12.2.1. Global Flagship Smartphone Market Volume Share, By Region, 2023 & 2032 112
12.2.2. Global Flagship Smartphone Market Revenue Share, By Region, 2023 & 2032 112
12.2.3. Flagship Smartphone Market Attractiveness Analysis, By Region 113
12.2.4. Incremental Revenue Growth Opportunity, by Region, 2024 – 2032 113
12.2.5. Flagship Smartphone Market Revenue, By Region, 2018, 2023, 2027 & 2032 114
12.2.6. Global Flagship Smartphone Market Volume & Revenue, By Region, 2018 – 2023 (Units) (USD Million) 115
12.2.7. Global Flagship Smartphone Market Volume & Revenue, By Region, 2024 – 2032 (Units) (USD Million) 115
12.3. Operating Systems 116
12.3.1. Global Flagship Smartphone Market Volume & Revenue, By Operating Systems, 2018 – 2023 (Units) (USD Million) 116
12.4. Global Flagship Smartphone Market Volume & Revenue, By Operating Systems, 2024 – 2032 (Units) (USD Million) 116
12.5. Specifications and Performance 117
12.5.1. Global Flagship Smartphone Market Volume & Revenue, By Specifications and Performance, 2018 – 2023 (Units) (USD Million) 117
12.5.2. Global Flagship Smartphone Market Volume & Revenue, By Specifications and Performance, 2024 – 2032 (Units) (USD Million) 118
12.6. Price Tiers 119
12.6.1. Global Flagship Smartphone Market Volume & Revenue, By Price Tiers, 2018 – 2023 (Units) (USD Million) 119
12.6.2. Global Flagship Smartphone Market Volume & Revenue, By Price Tiers, 2024 – 2032 (Units) (USD Million) 119
12.7. Camera Features 120
12.7.1. Global Flagship Smartphone Market Volume & Revenue, By Camera Features, 2018 – 2023 (Units) (USD Million) 120
12.7.2. Global Flagship Smartphone Market Volume & Revenue, By Camera Features, 2024 – 2032 (Units) (USD Million) 121
12.8. Distribution Channel 122
12.8.1. Global Flagship Smartphone Market Volume & Revenue, By Distribution Channel, 2018 – 2023 (Units) (USD Million) 122
12.8.2. Global Flagship Smartphone Market Volume & Revenue, By Distribution Channel, 2024 – 2032 (Units) (USD Million) 123
CHAPTER NO. 13 : FLAGSHIP SMARTPHONE MARKET – NORTH AMERICA 124
13.1. North America 124
13.1.1. Key Highlights 124
13.1.2. North America Flagship Smartphone Market Volume, By Country, 2018 – 2032 (Units) 125
13.1.3. North America Flagship Smartphone Market Revenue, By Country, 2018 – 2023 (USD Million) 126
13.1.4. North America Flagship Smartphone Market Volume, By Operating Systems, 2018 – 2023 (Units) 127
13.1.5. North America Flagship Smartphone Market Revenue, By Operating Systems, 2018 – 2023 (USD Million) 128
13.1.6. North America Flagship Smartphone Market Volume, By Specifications and Performance, 2018 – 2023 (Units) 129
13.1.7. North America Flagship Smartphone Market Revenue, By Specifications and Performance, 2018 – 2023 (USD Million) 130
13.1.8. North America Flagship Smartphone Market Volume, By Price Tiers, 2018 – 2023 (Units) 131
13.1.9. North America Flagship Smartphone Market Revenue, By Price Tiers, 2018 – 2023 (USD Million) 132
13.1.10. North America Flagship Smartphone Market Volume, By Camera Features, 2018 – 2023 (Units) 133
13.1.11. North America Flagship Smartphone Market Revenue, By Camera Features, 2018 – 2023 (USD Million) 134
13.1.12. North America Flagship Smartphone Market Volume, By Distribution Channel, 2018 – 2023 (Units) 135
13.1.13. North America Flagship Smartphone Market Revenue, By Distribution Channel, 2018 – 2023 (USD Million) 136
13.2. U.S. 137
13.3. Canada 137
13.4. Mexico 137
CHAPTER NO. 14 : FLAGSHIP SMARTPHONE MARKET – EUROPE 138
14.1. Europe 138
14.1.1. Key Highlights 138
14.1.2. Europe Flagship Smartphone Market Volume, By Country, 2018 – 2032 (Units) 139
14.1.3. Europe Flagship Smartphone Market Revenue, By Country, 2018 – 2023 (USD Million) 140
14.1.4. Europe Flagship Smartphone Market Volume, By Operating Systems, 2018 – 2023 (Units) 141
14.1.5. Europe Flagship Smartphone Market Revenue, By Operating Systems, 2018 – 2023 (USD Million) 142
14.1.6. Europe Flagship Smartphone Market Volume, By Specifications and Performance, 2018 – 2023 (Units) 143
14.1.7. Europe Flagship Smartphone Market Revenue, By Specifications and Performance, 2018 – 2023 (USD Million) 144
14.1.8. Europe Flagship Smartphone Market Volume, By Price Tiers, 2018 – 2023 (Units) 145
14.1.9. Europe Flagship Smartphone Market Revenue, By Price Tiers, 2018 – 2023 (USD Million) 146
14.1.10. Europe Flagship Smartphone Market Volume, By Camera Features, 2018 – 2023 (Units) 147
14.1.11. Europe Flagship Smartphone Market Revenue, By Camera Features, 2018 – 2023 (USD Million) 148
14.1.12. Europe Flagship Smartphone Market Volume, By Distribution Channel, 2018 – 2023 (Units) 149
14.1.13. Europe Flagship Smartphone Market Revenue, By Distribution Channel, 2018 – 2023 (USD Million) 150
14.2. UK 151
14.3. France 151
14.4. Germany 151
14.5. Italy 151
14.6. Spain 151
14.7. Russia 151
14.8. Belgium 151
14.9. Netherland 151
14.10. Austria 151
14.11. Sweden 151
14.12. Poland 151
14.13. Denmark 151
14.14. Switzerland 151
14.15. Rest of Europe 151
CHAPTER NO. 15 : FLAGSHIP SMARTPHONE MARKET – ASIA PACIFIC 152
15.1. Asia Pacific 152
15.1.1. Key Highlights 152
15.1.2. Asia Pacific Flagship Smartphone Market Volume, By Country, 2018 – 2032 (Units) 153
15.1.3. Asia Pacific Flagship Smartphone Market Revenue, By Country, 2018 – 2023 (USD Million) 154
15.1.4. Asia Pacific Flagship Smartphone Market Volume, By Operating Systems, 2018 – 2023 (Units) 155
15.1.5. Asia Pacific Flagship Smartphone Market Revenue, By Operating Systems, 2018 – 2023 (USD Million) 156
15.1.6. Asia Pacific Flagship Smartphone Market Volume, By Specifications and Performance, 2018 – 2023 (Units) 157
15.1.7. Asia Pacific Flagship Smartphone Market Revenue, By Specifications and Performance, 2018 – 2023 (USD Million) 158
15.1.8. Asia Pacific Flagship Smartphone Market Volume, By Price Tiers, 2018 – 2023 (Units) 159
15.1.9. Asia Pacific Flagship Smartphone Market Revenue, By Price Tiers, 2018 – 2023 (USD Million) 160
15.1.10. Asia Pacific Flagship Smartphone Market Volume, By Camera Features, 2018 – 2023 (Units) 161
15.1.11. Asia Pacific Flagship Smartphone Market Revenue, By Camera Features, 2018 – 2023 (USD Million) 162
15.1.12. Asia Pacific Flagship Smartphone Market Volume, By Distribution Channel, 2018 – 2023 (Units) 163
15.1.13. Asia Pacific Flagship Smartphone Market Revenue, By Distribution Channel, 2018 – 2023 (USD Million) 164
15.2. China 165
15.3. Japan 165
15.4. South Korea 165
15.5. India 165
15.6. Australia 165
15.7. Thailand 165
15.8. Indonesia 165
15.9. Vietnam 165
15.10. Malaysia 165
15.11. Philippines 165
15.12. Taiwan 165
15.13. Rest of Asia Pacific 165
CHAPTER NO. 16 : FLAGSHIP SMARTPHONE MARKET – LATIN AMERICA 166
16.1. Latin America 166
16.1.1. Key Highlights 166
16.1.2. Latin America Flagship Smartphone Market Volume, By Country, 2018 – 2032 (Units) 167
16.1.3. Latin America Flagship Smartphone Market Revenue, By Country, 2018 – 2023 (USD Million) 168
16.1.4. Latin America Flagship Smartphone Market Volume, By Operating Systems, 2018 – 2023 (Units) 169
16.1.5. Latin America Flagship Smartphone Market Revenue, By Operating Systems, 2018 – 2023 (USD Million) 170
16.1.6. Latin America Flagship Smartphone Market Volume, By Specifications and Performance, 2018 – 2023 (Units) 171
16.1.7. Latin America Flagship Smartphone Market Revenue, By Specifications and Performance, 2018 – 2023 (USD Million) 172
16.1.8. Latin America Flagship Smartphone Market Volume, By Price Tiers, 2018 – 2023 (Units) 173
16.1.9. Latin America Flagship Smartphone Market Revenue, By Price Tiers, 2018 – 2023 (USD Million) 174
16.1.10. Latin America Flagship Smartphone Market Volume, By Camera Features, 2018 – 2023 (Units) 175
16.1.11. Latin America Flagship Smartphone Market Revenue, By Camera Features, 2018 – 2023 (USD Million) 176
16.1.12. Latin America Flagship Smartphone Market Volume, By Distribution Channel, 2018 – 2023 (Units) 177
16.1.13. Latin America Flagship Smartphone Market Revenue, By Distribution Channel, 2018 – 2023 (USD Million) 178
16.2. Brazil 179
16.3. Argentina 179
16.4. Peru 179
16.5. Chile 179
16.6. Colombia 179
16.7. Rest of Latin America 179
CHAPTER NO. 17 : FLAGSHIP SMARTPHONE MARKET – MIDDLE EAST 180
17.1. Middle East 180
17.1.1. Key Highlights 180
17.1.2. Middle East Flagship Smartphone Market Volume, By Country, 2018 – 2032 (Units) 181
17.1.3. Middle East Flagship Smartphone Market Revenue, By Country, 2018 – 2023 (USD Million) 182
17.1.4. Middle East Flagship Smartphone Market Volume, By Operating Systems, 2018 – 2023 (Units) 183
17.1.5. Middle East Flagship Smartphone Market Revenue, By Operating Systems, 2018 – 2023 (USD Million) 184
17.1.6. Middle East Flagship Smartphone Market Volume, By Specifications and Performance, 2018 – 2023 (Units) 185
17.1.7. Middle East Flagship Smartphone Market Revenue, By Specifications and Performance, 2018 – 2023 (USD Million) 186
17.1.8. Middle East Flagship Smartphone Market Volume, By Price Tiers, 2018 – 2023 (Units) 187
17.1.9. Middle East Flagship Smartphone Market Revenue, By Price Tiers, 2018 – 2023 (USD Million) 188
17.1.10. Middle East Flagship Smartphone Market Volume, By Camera Features, 2018 – 2023 (Units) 189
17.1.11. Middle East Flagship Smartphone Market Revenue, By Camera Features, 2018 – 2023 (USD Million) 190
17.1.12. Middle East Flagship Smartphone Market Volume, By Distribution Channel, 2018 – 2023 (Units) 191
17.1.13. Middle East Flagship Smartphone Market Revenue, By Distribution Channel, 2018 – 2023 (USD Million) 192
17.2. UAE 193
17.3. KSA 193
17.4. Israel 193
17.5. Turkey 193
17.6. Iran 193
17.7. Rest of Middle East 193
CHAPTER NO. 18 : FLAGSHIP SMARTPHONE MARKET – AFRICA 194
18.1. Africa 194
18.1.1. Key Highlights 194
18.1.2. Africa Flagship Smartphone Market Volume, By Country, 2018 – 2032 (Units) 195
18.1.3. Africa Flagship Smartphone Market Revenue, By Country, 2018 – 2023 (USD Million) 196
18.1.4. Africa Flagship Smartphone Market Volume, By Operating Systems, 2018 – 2023 (Units) 197
18.1.5. Africa Flagship Smartphone Market Revenue, By Operating Systems, 2018 – 2023 (USD Million) 198
18.1.6. Africa Flagship Smartphone Market Volume, By Specifications and Performance, 2018 – 2023 (Units) 199
18.1.7. Africa Flagship Smartphone Market Revenue, By Specifications and Performance, 2018 – 2023 (USD Million) 200
18.1.8. Africa Flagship Smartphone Market Volume, By Price Tiers, 2018 – 2023 (Units) 201
18.1.9. Africa Flagship Smartphone Market Revenue, By Price Tiers, 2018 – 2023 (USD Million) 202
18.1.10. Africa Flagship Smartphone Market Volume, By Camera Features, 2018 – 2023 (Units) 203
18.1.11. Africa Flagship Smartphone Market Revenue, By Camera Features, 2018 – 2023 (USD Million) 204
18.1.12. Africa Flagship Smartphone Market Volume, By Distribution Channel, 2018 – 2023 (Units) 205
18.1.13. Africa Flagship Smartphone Market Revenue, By Distribution Channel, 2018 – 2023 (USD Million) 206
18.2. Egypt 207
18.3. Nigeria 207
18.4. Algeria 207
18.5. Morocco 207
18.6. Rest of Africa 207
CHAPTER NO. 19 : COMPANY PROFILES 208
19.1. Samsung Electronics Co. Ltd. 208
19.1.1. Company Overview 208
19.1.2. Product Portfolio 208
19.1.3. Swot Analysis 208
19.1.4. Business Strategy 208
19.1.5. Financial Overview 209
19.2. Apple Inc. 210
19.3. Oppo 210
19.4. OnePlus and Mobitech Creations 210
19.5. Xiaomi 210
19.6. Huawei Technologies Co. Ltd. 210
19.7. LG Electronics Inc. 210
19.8. Lenovo Group Limited 210
19.9. ZTE Corporation 210
19.10. TCL Communication Technology Holdings Limited 210
19.11. Vivo Communication Technology Co. Ltd. 210
CHAPTER NO. 20 : RESEARCH METHODOLOGY 211
20.1. Research Methodology 211
20.1.1. Phase I – Secondary Research 212
20.1.2. Phase II – Data Modeling 212
Company Share Analysis Model 213
Revenue Based Modeling 213
20.1.3. Phase III – Primary Research 214
20.1.4. Research Limitations 215
Assumptions 215
List of Figures
FIG NO. 1. Global Flagship Smartphone Market Volume & Revenue, 2018 – 2032 (Units) (USD Million) 36
FIG NO. 2. Porter’s Five Forces Analysis for Global Flagship Smartphone Market 44
FIG NO. 3. Company Share Analysis, 2023 45
FIG NO. 4. Company Share Analysis, 2023 46
FIG NO. 5. Company Share Analysis, 2023 46
FIG NO. 6. Company Share Analysis, 2023 47
FIG NO. 7. Flagship Smartphone Market – Company Volume Market Share, 2023 48
FIG NO. 8. Flagship Smartphone Market – Company Revenue Market Share, 2023 49
FIG NO. 9. Flagship Smartphone Market Volume Share, By Operating Systems, 2023 & 2032 55
FIG NO. 10. Flagship Smartphone Market Revenue Share, By Operating Systems, 2023 & 2032 55
FIG NO. 11. Market Attractiveness Analysis, By Operating Systems 56
FIG NO. 12. Incremental Revenue Growth Opportunity by Operating Systems, 2024 – 2032 56
FIG NO. 13. Flagship Smartphone Market Revenue, By Operating Systems, 2018, 2023, 2027 & 2032 57
FIG NO. 14. Global Flagship Smartphone Market for Android Flagship Smartphones, Volume & Revenue (Units) (USD Million) 2018 – 2032 58
FIG NO. 15. Global Flagship Smartphone Market for iOS Flagship Smartphones, Volume & Revenue (Units) (USD Million) 2018 – 2032 60
FIG NO. 16. Flagship Smartphone Market Volume Share, By Specifications and Performance, 2023 & 2032 63
FIG NO. 17. Flagship Smartphone Market Revenue Share, By Specifications and Performance, 2023 & 2032 63
FIG NO. 18. Market Attractiveness Analysis, By Specifications and Performance 64
FIG NO. 19. Incremental Revenue Growth Opportunity by Specifications and Performance, 2024 – 2032 64
FIG NO. 20. Flagship Smartphone Market Revenue, By Specifications and Performance, 2018, 2023, 2027 & 2032 65
FIG NO. 21. Global Flagship Smartphone Market for Camera-Centric Flagships, Volume & Revenue (Units) (USD Million) 2018 – 2032 66
FIG NO. 22. Global Flagship Smartphone Market for Performance Powerhouses, Volume & Revenue (Units) (USD Million) 2018 – 2032 68
FIG NO. 23. Global Flagship Smartphone Market for Multimedia and Entertainment, Volume & Revenue (Units) (USD Million) 2018 – 2032 70
FIG NO. 24. Global Flagship Smartphone Market for Battery Life and Endurance, Volume & Revenue (Units) (USD Million) 2018 – 2032 72
FIG NO. 25. Global Flagship Smartphone Market for Innovative Features, Volume & Revenue (Units) (USD Million) 2018 – 2032 74
FIG NO. 26. Flagship Smartphone Market Volume Share, By Price Tiers, 2023 & 2032 77
FIG NO. 27. Flagship Smartphone Market Revenue Share, By Price Tiers, 2023 & 2032 77
FIG NO. 28. Market Attractiveness Analysis, By Price Tiers 78
FIG NO. 29. Incremental Revenue Growth Opportunity by Price Tiers, 2024 – 2032 78
FIG NO. 30. Flagship Smartphone Market Revenue, By Price Tiers, 2018, 2023, 2027 & 2032 79
FIG NO. 31. Global Flagship Smartphone Market for Ultra-Premium Flagships, Volume & Revenue (Units) (USD Million) 2018 – 2032 80
FIG NO. 32. Global Flagship Smartphone Market for Mid-Range Flagships, Volume & Revenue (Units) (USD Million) 2018 – 2032 82
FIG NO. 33. Global Flagship Smartphone Market for Budget Flagships, Volume & Revenue (Units) (USD Million) 2018 – 2032 84
FIG NO. 34. Flagship Smartphone Market Volume Share, By Camera Features, 2023 & 2032 87
FIG NO. 35. Flagship Smartphone Market Revenue Share, By Camera Features, 2023 & 2032 87
FIG NO. 36. Market Attractiveness Analysis, By Camera Features 88
FIG NO. 37. Incremental Revenue Growth Opportunity by Camera Features, 2024 – 2032 88
FIG NO. 38. Flagship Smartphone Market Revenue, By Camera Features, 2018, 2023, 2027 & 2032 89
FIG NO. 39. Global Flagship Smartphone Market for High Megapixel Cameras, Volume & Revenue (Units) (USD Million) 2018 – 2032 90
FIG NO. 40. Global Flagship Smartphone Market for Camera Array Flagships, Volume & Revenue (Units) (USD Million) 2018 – 2032 92
FIG NO. 41. Global Flagship Smartphone Market for Night Mode and Low-Light Performance, Volume & Revenue (Units) (USD Million) 2018 – 2032 94
FIG NO. 42. Global Flagship Smartphone Market for Videography Flagships, Volume & Revenue (Units) (USD Million) 2018 – 2032 96
FIG NO. 43. Flagship Smartphone Market Volume Share, By Distribution Channel, 2023 & 2032 99
FIG NO. 44. Flagship Smartphone Market Revenue Share, By Distribution Channel, 2023 & 2032 99
FIG NO. 45. Market Attractiveness Analysis, By Distribution Channel 100
FIG NO. 46. Incremental Revenue Growth Opportunity by Distribution Channel, 2024 – 2032 100
FIG NO. 47. Flagship Smartphone Market Revenue, By Distribution Channel, 2018, 2023, 2027 & 2032 101
FIG NO. 48. Global Flagship Smartphone Market for OLED and AMOLED Displays, Volume & Revenue (Units) (USD Million) 2018 – 2032 102
FIG NO. 49. Global Flagship Smartphone Market for High Refresh Rate Displays, Volume & Revenue (Units) (USD Million) 2018 – 2032 105
FIG NO. 50. Global Flagship Smartphone Market for Foldable Flagships, Volume & Revenue (Units) (USD Million) 2018 – 2032 108
FIG NO. 51. Global Flagship Smartphone Market Volume Share, By Region, 2023 & 2032 112
FIG NO. 52. Global Flagship Smartphone Market Revenue Share, By Region, 2023 & 2032 112
FIG NO. 53. Market Attractiveness Analysis, By Region 113
FIG NO. 54. Incremental Revenue Growth Opportunity by Region, 2024 – 2032 113
FIG NO. 55. Flagship Smartphone Market Revenue, By Region, 2018, 2023, 2027 & 2032 114
FIG NO. 56. North America Flagship Smartphone Market Volume & Revenue, 2018 – 2032 (Units) (USD Million) 124
FIG NO. 57. Europe Flagship Smartphone Market Volume & Revenue, 2018 – 2032 (Units) (USD Million) 138
FIG NO. 58. Asia Pacific Flagship Smartphone Market Volume & Revenue, 2018 – 2032 (Units) (USD Million) 152
FIG NO. 59. Latin America Flagship Smartphone Market Volume & Revenue, 2018 – 2032 (Units) (USD Million) 166
FIG NO. 60. Middle East Flagship Smartphone Market Volume & Revenue, 2018 – 2032 (Units) (USD Million) 180
FIG NO. 61. Africa Flagship Smartphone Market Volume & Revenue, 2018 – 2032 (Units) (USD Million) 194
FIG NO. 62. Research Methodology – Detailed View 211
FIG NO. 63. Research Methodology 212
List of Tables
TABLE NO. 1. : Global Flagship Smartphone Market: Snapshot 34
TABLE NO. 2. : Drivers for the Flagship Smartphone Market: Impact Analysis 40
TABLE NO. 3. : Restraints for the Flagship Smartphone Market: Impact Analysis 42
TABLE NO. 4. : Global Android Flagship Smartphones Flagship Smartphone Market Volume & Revenue, By Region, 2018 – 2023 (Units) (USD Million) 59
TABLE NO. 5. : Global Android Flagship Smartphones Flagship Smartphone Market Volume & Revenue, By Region, 2024 – 2032 (Units) (USD Million) 59
TABLE NO. 6. : Global iOS Flagship Smartphones Flagship Smartphone Market Volume & Revenue, By Region, 2018 – 2023 (Units) (USD Million) 61
TABLE NO. 7. : Global iOS Flagship Smartphones Flagship Smartphone Market Volume & Revenue, By Region, 2024 – 2032 (Units) (USD Million) 61
TABLE NO. 8. : Global Camera-Centric Flagships Flagship Smartphone Market Volume & Revenue, By Region, 2018 – 2023 (Units) (USD Million) 67
TABLE NO. 9. : Global Camera-Centric Flagships Flagship Smartphone Market Volume & Revenue, By Region, 2024 – 2032 (Units) (USD Million) 67
TABLE NO. 10. : Global Performance Powerhouses Flagship Smartphone Market Volume & Revenue, By Region, 2018 – 2023 (Units) (USD Million) 69
TABLE NO. 11. : Global Performance Powerhouses Flagship Smartphone Market Volume & Revenue, By Region, 2024 – 2032 (Units) (USD Million) 69
TABLE NO. 12. : Global Multimedia and Entertainment Flagship Smartphone Market Volume & Revenue, By Region, 2018 – 2023 (Units) (USD Million) 71
TABLE NO. 13. : Global Multimedia and Entertainment Flagship Smartphone Market Volume & Revenue, By Region, 2024 – 2032 (Units) (USD Million) 71
TABLE NO. 14. : Global Battery Life and Endurance Flagship Smartphone Market Volume & Revenue, By Region, 2018 – 2023 (Units) (USD Million) 73
TABLE NO. 15. : Global Battery Life and Endurance Flagship Smartphone Market Volume & Revenue, By Region, 2024 – 2032 (Units) (USD Million) 73
TABLE NO. 16. : Global Innovative Features Flagship Smartphone Market Volume & Revenue, By Region, 2018 – 2023 (Units) (USD Million) 75
TABLE NO. 17. : Global Innovative Features Flagship Smartphone Market Volume & Revenue, By Region, 2024 – 2032 (Units) (USD Million) 75
TABLE NO. 18. : Global Ultra-Premium Flagships Flagship Smartphone Market Volume & Revenue, By Region, 2018 – 2023 (Units) (USD Million) 81
TABLE NO. 19. : Global Ultra-Premium Flagships Flagship Smartphone Market Volume & Revenue, By Region, 2024 – 2032 (Units) (USD Million) 81
TABLE NO. 20. : Global Mid-Range Flagships Flagship Smartphone Market Volume & Revenue, By Region, 2018 – 2023 (Units) (USD Million) 83
TABLE NO. 21. : Global Mid-Range Flagships Flagship Smartphone Market Volume & Revenue, By Region, 2024 – 2032 (Units) (USD Million) 83
TABLE NO. 22. : Global Budget Flagships Flagship Smartphone Market Volume & Revenue, By Region, 2018 – 2023 (Units) (USD Million) 85
TABLE NO. 23. : Global Budget Flagships Flagship Smartphone Market Volume & Revenue, By Region, 2024 – 2032 (Units) (USD Million) 85
TABLE NO. 24. : Global High Megapixel Cameras Flagship Smartphone Market Volume & Revenue, By Region, 2018 – 2023 (Units) (USD Million) 91
TABLE NO. 25. : Global High Megapixel Cameras Flagship Smartphone Market Volume & Revenue, By Region, 2024 – 2032 (Units) (USD Million) 91
TABLE NO. 26. : Global Camera Array Flagships Flagship Smartphone Market Volume & Revenue, By Region, 2018 – 2023 (Units) (USD Million) 93
TABLE NO. 27. : Global Camera Array Flagships Flagship Smartphone Market Volume & Revenue, By Region, 2024 – 2032 (Units) (USD Million) 93
TABLE NO. 28. : Global Night Mode and Low-Light Performance Flagship Smartphone Market Volume & Revenue, By Region, 2018 – 2023 (Units) (USD Million) 95
TABLE NO. 29. : Global Night Mode and Low-Light Performance Flagship Smartphone Market Volume & Revenue, By Region, 2024 – 2032 (Units) (USD Million) 95
TABLE NO. 30. : Global Videography Flagships Flagship Smartphone Market Volume & Revenue, By Region, 2018 – 2023 (Units) (USD Million) 97
TABLE NO. 31. : Global Videography Flagships Flagship Smartphone Market Volume & Revenue, By Region, 2024 – 2032 (Units) (USD Million) 97
TABLE NO. 32. : Global OLED and AMOLED Displays Flagship Smartphone Market Volume & Revenue, By Region, 2018 – 2023 (Units) (USD Million) 103
TABLE NO. 33. : Global OLED and AMOLED Displays Flagship Smartphone Market Volume & Revenue, By Region, 2024 – 2032 (Units) (USD Million) 104
TABLE NO. 34. : Global High Refresh Rate Displays Flagship Smartphone Market Volume & Revenue, By Region, 2018 – 2023 (Units) (USD Million) 106
TABLE NO. 35. : Global High Refresh Rate Displays Flagship Smartphone Market Volume & Revenue, By Region, 2024 – 2032 (Units) (USD Million) 107
TABLE NO. 36. : Global Foldable Flagships Flagship Smartphone Market Volume & Revenue, By Region, 2018 – 2023 (Units) (USD Million) 109
TABLE NO. 37. : Global Foldable Flagships Flagship Smartphone Market Volume & Revenue, By Region, 2024 – 2032 (Units) (USD Million) 110
TABLE NO. 38. : Global Flagship Smartphone Market Volume & Revenue, By Region, 2018 – 2023 (Units) (USD Million) 115
TABLE NO. 39. : Global Flagship Smartphone Market Volume & Revenue, By Region, 2024 – 2032 (Units) (USD Million) 115
TABLE NO. 40. : Global Flagship Smartphone Market Volume & Revenue, By Operating Systems, 2018 – 2023 (Units) (USD Million) 116
TABLE NO. 41. : Global Flagship Smartphone Market Volume & Revenue, By Operating Systems, 2024 – 2032 (Units) (USD Million) 116
TABLE NO. 42. : Global Flagship Smartphone Market Volume & Revenue, By Specifications and Performance, 2018 – 2023 (Units) (USD Million) 117
TABLE NO. 43. : Global Flagship Smartphone Market Volume & Revenue, By Specifications and Performance, 2024 – 2032 (Units) (USD Million) 118
TABLE NO. 44. : Global Flagship Smartphone Market Volume & Revenue, By Price Tiers, 2018 – 2023 (Units) (USD Million) 119
TABLE NO. 45. : Global Flagship Smartphone Market Volume & Revenue, By Price Tiers, 2024 – 2032 (Units) (USD Million) 119
TABLE NO. 46. : Global Flagship Smartphone Market Volume & Revenue, By Camera Features, 2018 – 2023 (Units) (USD Million) 120
TABLE NO. 47. : Global Flagship Smartphone Market Volume & Revenue, By Camera Features, 2024 – 2032 (Units) (USD Million) 121
TABLE NO. 48. : Global Flagship Smartphone Market Volume & Revenue, By Distribution Channel, 2018 – 2023 (Units) (USD Million) 122
TABLE NO. 49. : Global Flagship Smartphone Market Volume & Revenue, By Distribution Channel, 2024 – 2032 (Units) (USD Million) 123
TABLE NO. 50. : North America Flagship Smartphone Market Volume, By Country, 2018 – 2023 (Units) 125
TABLE NO. 51. : North America Flagship Smartphone Market Volume, By Country, 2024 – 2032 (Units) 125
TABLE NO. 52. : North America Flagship Smartphone Market Revenue, By Country, 2018 – 2023 (USD Million) 126
TABLE NO. 53. : North America Flagship Smartphone Market Revenue, By Country, 2024 – 2032 (USD Million) 126
TABLE NO. 54. : North America Flagship Smartphone Market Volume, By Operating Systems, 2018 – 2023 (Units) 127
TABLE NO. 55. : North America Flagship Smartphone Market Volume, By Operating Systems, 2024 – 2032 (Units) 127
TABLE NO. 56. : North America Flagship Smartphone Market Revenue, By Operating Systems, 2018 – 2023 (USD Million) 128
TABLE NO. 57. : North America Flagship Smartphone Market Revenue, By Operating Systems, 2024 – 2032 (USD Million) 128
TABLE NO. 58. : North America Flagship Smartphone Market Volume, By Specifications and Performance, 2018 – 2023 (Units) 129
TABLE NO. 59. : North America Flagship Smartphone Market Volume, By Specifications and Performance, 2024 – 2032 (Units) 129
TABLE NO. 60. : North America Flagship Smartphone Market Revenue, By Specifications and Performance, 2018 – 2023 (USD Million) 130
TABLE NO. 61. : North America Flagship Smartphone Market Revenue, By Specifications and Performance, 2024 – 2032 (USD Million) 130
TABLE NO. 62. : North America Flagship Smartphone Market Volume, By Price Tiers, 2018 – 2023 (Units) 131
TABLE NO. 63. : North America Flagship Smartphone Market Volume, By Price Tiers, 2024 – 2032 (Units) 131
TABLE NO. 64. : North America Flagship Smartphone Market Revenue, By Price Tiers, 2018 – 2023 (USD Million) 132
TABLE NO. 65. : North America Flagship Smartphone Market Revenue, By Price Tiers, 2024 – 2032 (USD Million) 132
TABLE NO. 66. : North America Flagship Smartphone Market Volume, By Camera Features, 2018 – 2023 (Units) 133
TABLE NO. 67. : North America Flagship Smartphone Market Volume, By Camera Features, 2024 – 2032 (Units) 133
TABLE NO. 68. : North America Flagship Smartphone Market Revenue, By Camera Features, 2018 – 2023 (USD Million) 134
TABLE NO. 69. : North America Flagship Smartphone Market Revenue, By Camera Features, 2024 – 2032 (USD Million) 134
TABLE NO. 70. : North America Flagship Smartphone Market Volume, By Distribution Channel, 2018 – 2023 (Units) 135
TABLE NO. 71. : North America Flagship Smartphone Market Volume, By Distribution Channel, 2024 – 2032 (Units) 135
TABLE NO. 72. : North America Flagship Smartphone Market Revenue, By Distribution Channel, 2018 – 2023 (USD Million) 136
TABLE NO. 73. : North America Flagship Smartphone Market Revenue, By Distribution Channel, 2024 – 2032 (USD Million) 136
TABLE NO. 74. : Europe Flagship Smartphone Market Volume, By Country, 2018 – 2023 (Units) 139
TABLE NO. 75. : Europe Flagship Smartphone Market Volume, By Country, 2024 – 2032 (Units) 139
TABLE NO. 76. : Europe Flagship Smartphone Market Revenue, By Country, 2018 – 2023 (USD Million) 140
TABLE NO. 77. : Europe Flagship Smartphone Market Revenue, By Country, 2024 – 2032 (USD Million) 140
TABLE NO. 78. : Europe Flagship Smartphone Market Volume, By Operating Systems, 2018 – 2023 (Units) 141
TABLE NO. 79. : Europe Flagship Smartphone Market Volume, By Operating Systems, 2024 – 2032 (Units) 141
TABLE NO. 80. : Europe Flagship Smartphone Market Revenue, By Operating Systems, 2018 – 2023 (USD Million) 142
TABLE NO. 81. : Europe Flagship Smartphone Market Revenue, By Operating Systems, 2024 – 2032 (USD Million) 142
TABLE NO. 82. : Europe Flagship Smartphone Market Volume, By Specifications and Performance, 2018 – 2023 (Units) 143
TABLE NO. 83. : Europe Flagship Smartphone Market Volume, By Specifications and Performance, 2024 – 2032 (Units) 143
TABLE NO. 84. : Europe Flagship Smartphone Market Revenue, By Specifications and Performance, 2018 – 2023 (USD Million) 144
TABLE NO. 85. : Europe Flagship Smartphone Market Revenue, By Specifications and Performance, 2024 – 2032 (USD Million) 144
TABLE NO. 86. : Europe Flagship Smartphone Market Volume, By Price Tiers, 2018 – 2023 (Units) 145
TABLE NO. 87. : Europe Flagship Smartphone Market Volume, By Price Tiers, 2024 – 2032 (Units) 145
TABLE NO. 88. : Europe Flagship Smartphone Market Revenue, By Price Tiers, 2018 – 2023 (USD Million) 146
TABLE NO. 89. : Europe Flagship Smartphone Market Revenue, By Price Tiers, 2024 – 2032 (USD Million) 146
TABLE NO. 90. : Europe Flagship Smartphone Market Volume, By Camera Features, 2018 – 2023 (Units) 147
TABLE NO. 91. : Europe Flagship Smartphone Market Volume, By Camera Features, 2024 – 2032 (Units) 147
TABLE NO. 92. : Europe Flagship Smartphone Market Revenue, By Camera Features, 2018 – 2023 (USD Million) 148
TABLE NO. 93. : Europe Flagship Smartphone Market Revenue, By Camera Features, 2024 – 2032 (USD Million) 148
TABLE NO. 94. : Europe Flagship Smartphone Market Volume, By Distribution Channel, 2018 – 2023 (Units) 149
TABLE NO. 95. : Europe Flagship Smartphone Market Volume, By Distribution Channel, 2024 – 2032 (Units) 149
TABLE NO. 96. : Europe Flagship Smartphone Market Revenue, By Distribution Channel, 2018 – 2023 (USD Million) 150
TABLE NO. 97. : Europe Flagship Smartphone Market Revenue, By Distribution Channel, 2024 – 2032 (USD Million) 150
TABLE NO. 98. : Asia Pacific Flagship Smartphone Market Volume, By Country, 2018 – 2023 (Units) 153
TABLE NO. 99. : Asia Pacific Flagship Smartphone Market Volume, By Country, 2024 – 2032 (Units) 153
TABLE NO. 100. : Asia Pacific Flagship Smartphone Market Revenue, By Country, 2018 – 2023 (USD Million) 154
TABLE NO. 101. : Asia Pacific Flagship Smartphone Market Revenue, By Country, 2024 – 2032 (USD Million) 154
TABLE NO. 102. : Asia Pacific Flagship Smartphone Market Volume, By Operating Systems, 2018 – 2023 (Units) 155
TABLE NO. 103. : Asia Pacific Flagship Smartphone Market Volume, By Operating Systems, 2024 – 2032 (Units) 155
TABLE NO. 104. : Asia Pacific Flagship Smartphone Market Revenue, By Operating Systems, 2018 – 2023 (USD Million) 156
TABLE NO. 105. : Asia Pacific Flagship Smartphone Market Revenue, By Operating Systems, 2024 – 2032 (USD Million) 156
TABLE NO. 106. : Asia Pacific Flagship Smartphone Market Volume, By Specifications and Performance, 2018 – 2023 (Units) 157
TABLE NO. 107. : Asia Pacific Flagship Smartphone Market Volume, By Specifications and Performance, 2024 – 2032 (Units) 157
TABLE NO. 108. : Asia Pacific Flagship Smartphone Market Revenue, By Specifications and Performance, 2018 – 2023 (USD Million) 158
TABLE NO. 109. : Asia Pacific Flagship Smartphone Market Revenue, By Specifications and Performance, 2024 – 2032 (USD Million) 158
TABLE NO. 110. : Asia Pacific Flagship Smartphone Market Volume, By Price Tiers, 2018 – 2023 (Units) 159
TABLE NO. 111. : Asia Pacific Flagship Smartphone Market Volume, By Price Tiers, 2024 – 2032 (Units) 159
TABLE NO. 112. : Asia Pacific Flagship Smartphone Market Revenue, By Price Tiers, 2018 – 2023 (USD Million) 160
TABLE NO. 113. : Asia Pacific Flagship Smartphone Market Revenue, By Price Tiers, 2024 – 2032 (USD Million) 160
TABLE NO. 114. : Asia Pacific Flagship Smartphone Market Volume, By Camera Features, 2018 – 2023 (Units) 161
TABLE NO. 115. : Asia Pacific Flagship Smartphone Market Volume, By Camera Features, 2024 – 2032 (Units) 161
TABLE NO. 116. : Asia Pacific Flagship Smartphone Market Revenue, By Camera Features, 2018 – 2023 (USD Million) 162
TABLE NO. 117. : Asia Pacific Flagship Smartphone Market Revenue, By Camera Features, 2024 – 2032 (USD Million) 162
TABLE NO. 118. : Asia Pacific Flagship Smartphone Market Volume, By Distribution Channel, 2018 – 2023 (Units) 163
TABLE NO. 119. : Asia Pacific Flagship Smartphone Market Volume, By Distribution Channel, 2024 – 2032 (Units) 163
TABLE NO. 120. : Asia Pacific Flagship Smartphone Market Revenue, By Distribution Channel, 2018 – 2023 (USD Million) 164
TABLE NO. 121. : Asia Pacific Flagship Smartphone Market Revenue, By Distribution Channel, 2024 – 2032 (USD Million) 164
TABLE NO. 122. : Latin America Flagship Smartphone Market Volume, By Country, 2018 – 2023 (Units) 167
TABLE NO. 123. : Latin America Flagship Smartphone Market Volume, By Country, 2024 – 2032 (Units) 167
TABLE NO. 124. : Latin America Flagship Smartphone Market Revenue, By Country, 2018 – 2023 (USD Million) 168
TABLE NO. 125. : Latin America Flagship Smartphone Market Revenue, By Country, 2024 – 2032 (USD Million) 168
TABLE NO. 126. : Latin America Flagship Smartphone Market Volume, By Operating Systems, 2018 – 2023 (Units) 169
TABLE NO. 127. : Latin America Flagship Smartphone Market Volume, By Operating Systems, 2024 – 2032 (Units) 169
TABLE NO. 128. : Latin America Flagship Smartphone Market Revenue, By Operating Systems, 2018 – 2023 (USD Million) 170
TABLE NO. 129. : Latin America Flagship Smartphone Market Revenue, By Operating Systems, 2024 – 2032 (USD Million) 170
TABLE NO. 130. : Latin America Flagship Smartphone Market Volume, By Specifications and Performance, 2018 – 2023 (Units) 171
TABLE NO. 131. : Latin America Flagship Smartphone Market Volume, By Specifications and Performance, 2024 – 2032 (Units) 171
TABLE NO. 132. : Latin America Flagship Smartphone Market Revenue, By Specifications and Performance, 2018 – 2023 (USD Million) 172
TABLE NO. 133. : Latin America Flagship Smartphone Market Revenue, By Specifications and Performance, 2024 – 2032 (USD Million) 172
TABLE NO. 134. : Latin America Flagship Smartphone Market Volume, By Price Tiers, 2018 – 2023 (Units) 173
TABLE NO. 135. : Latin America Flagship Smartphone Market Volume, By Price Tiers, 2024 – 2032 (Units) 173
TABLE NO. 136. : Latin America Flagship Smartphone Market Revenue, By Price Tiers, 2018 – 2023 (USD Million) 174
TABLE NO. 137. : Latin America Flagship Smartphone Market Revenue, By Price Tiers, 2024 – 2032 (USD Million) 174
TABLE NO. 138. : Latin America Flagship Smartphone Market Volume, By Camera Features, 2018 – 2023 (Units) 175
TABLE NO. 139. : Latin America Flagship Smartphone Market Volume, By Camera Features, 2024 – 2032 (Units) 175
TABLE NO. 140. : Latin America Flagship Smartphone Market Revenue, By Camera Features, 2018 – 2023 (USD Million) 176
TABLE NO. 141. : Latin America Flagship Smartphone Market Revenue, By Camera Features, 2024 – 2032 (USD Million) 176
TABLE NO. 142. : Latin America Flagship Smartphone Market Volume, By Distribution Channel, 2018 – 2023 (Units) 177
TABLE NO. 143. : Latin America Flagship Smartphone Market Volume, By Distribution Channel, 2024 – 2032 (Units) 177
TABLE NO. 144. : Latin America Flagship Smartphone Market Revenue, By Distribution Channel, 2018 – 2023 (USD Million) 178
TABLE NO. 145. : Latin America Flagship Smartphone Market Revenue, By Distribution Channel, 2024 – 2032 (USD Million) 178
TABLE NO. 146. : Middle East Flagship Smartphone Market Volume, By Country, 2018 – 2023 (Units) 181
TABLE NO. 147. : Middle East Flagship Smartphone Market Volume, By Country, 2024 – 2032 (Units) 181
TABLE NO. 148. : Middle East Flagship Smartphone Market Revenue, By Country, 2018 – 2023 (USD Million) 182
TABLE NO. 149. : Middle East Flagship Smartphone Market Revenue, By Country, 2024 – 2032 (USD Million) 182
TABLE NO. 150. : Middle East Flagship Smartphone Market Volume, By Operating Systems, 2018 – 2023 (Units) 183
TABLE NO. 151. : Middle East Flagship Smartphone Market Volume, By Operating Systems, 2024 – 2032 (Units) 183
TABLE NO. 152. : Middle East Flagship Smartphone Market Revenue, By Operating Systems, 2018 – 2023 (USD Million) 184
TABLE NO. 153. : Middle East Flagship Smartphone Market Revenue, By Operating Systems, 2024 – 2032 (USD Million) 184
TABLE NO. 154. : Middle East Flagship Smartphone Market Volume, By Specifications and Performance, 2018 – 2023 (Units) 185
TABLE NO. 155. : Middle East Flagship Smartphone Market Volume, By Specifications and Performance, 2024 – 2032 (Units) 185
TABLE NO. 156. : Middle East Flagship Smartphone Market Revenue, By Specifications and Performance, 2018 – 2023 (USD Million) 186
TABLE NO. 157. : Middle East Flagship Smartphone Market Revenue, By Specifications and Performance, 2024 – 2032 (USD Million) 186
TABLE NO. 158. : Middle East Flagship Smartphone Market Volume, By Price Tiers, 2018 – 2023 (Units) 187
TABLE NO. 159. : Middle East Flagship Smartphone Market Volume, By Price Tiers, 2024 – 2032 (Units) 187
TABLE NO. 160. : Middle East Flagship Smartphone Market Revenue, By Price Tiers, 2018 – 2023 (USD Million) 188
TABLE NO. 161. : Middle East Flagship Smartphone Market Revenue, By Price Tiers, 2024 – 2032 (USD Million) 188
TABLE NO. 162. : Middle East Flagship Smartphone Market Volume, By Camera Features, 2018 – 2023 (Units) 189
TABLE NO. 163. : Middle East Flagship Smartphone Market Volume, By Camera Features, 2024 – 2032 (Units) 189
TABLE NO. 164. : Middle East Flagship Smartphone Market Revenue, By Camera Features, 2018 – 2023 (USD Million) 190
TABLE NO. 165. : Middle East Flagship Smartphone Market Revenue, By Camera Features, 2024 – 2032 (USD Million) 190
TABLE NO. 166. : Middle East Flagship Smartphone Market Volume, By Distribution Channel, 2018 – 2023 (Units) 191
TABLE NO. 167. : Middle East Flagship Smartphone Market Volume, By Distribution Channel, 2024 – 2032 (Units) 191
TABLE NO. 168. : Middle East Flagship Smartphone Market Revenue, By Distribution Channel, 2018 – 2023 (USD Million) 192
TABLE NO. 169. : Middle East Flagship Smartphone Market Revenue, By Distribution Channel, 2024 – 2032 (USD Million) 192
TABLE NO. 170. : Africa Flagship Smartphone Market Volume, By Country, 2018 – 2023 (Units) 195
TABLE NO. 171. : Africa Flagship Smartphone Market Volume, By Country, 2024 – 2032 (Units) 195
TABLE NO. 172. : Africa Flagship Smartphone Market Revenue, By Country, 2018 – 2023 (USD Million) 196
TABLE NO. 173. : Africa Flagship Smartphone Market Revenue, By Country, 2024 – 2032 (USD Million) 196
TABLE NO. 174. : Africa Flagship Smartphone Market Volume, By Operating Systems, 2018 – 2023 (Units) 197
TABLE NO. 175. : Africa Flagship Smartphone Market Volume, By Operating Systems, 2024 – 2032 (Units) 197
TABLE NO. 176. : Africa Flagship Smartphone Market Revenue, By Operating Systems, 2018 – 2023 (USD Million) 198
TABLE NO. 177. : Africa Flagship Smartphone Market Revenue, By Operating Systems, 2024 – 2032 (USD Million) 198
TABLE NO. 178. : Africa Flagship Smartphone Market Volume, By Specifications and Performance, 2018 – 2023 (Units) 199
TABLE NO. 179. : Africa Flagship Smartphone Market Volume, By Specifications and Performance, 2024 – 2032 (Units) 199
TABLE NO. 180. : Africa Flagship Smartphone Market Revenue, By Specifications and Performance, 2018 – 2023 (USD Million) 200
TABLE NO. 181. : Africa Flagship Smartphone Market Revenue, By Specifications and Performance, 2024 – 2032 (USD Million) 200
TABLE NO. 182. : Africa Flagship Smartphone Market Volume, By Price Tiers, 2018 – 2023 (Units) 201
TABLE NO. 183. : Africa Flagship Smartphone Market Volume, By Price Tiers, 2024 – 2032 (Units) 201
TABLE NO. 184. : Africa Flagship Smartphone Market Revenue, By Price Tiers, 2018 – 2023 (USD Million) 202
TABLE NO. 185. : Africa Flagship Smartphone Market Revenue, By Price Tiers, 2024 – 2032 (USD Million) 202
TABLE NO. 186. : Africa Flagship Smartphone Market Volume, By Camera Features, 2018 – 2023 (Units) 203
TABLE NO. 187. : Africa Flagship Smartphone Market Volume, By Camera Features, 2024 – 2032 (Units) 203
TABLE NO. 188. : Africa Flagship Smartphone Market Revenue, By Camera Features, 2018 – 2023 (USD Million) 204
TABLE NO. 189. : Africa Flagship Smartphone Market Revenue, By Camera Features, 2024 – 2032 (USD Million) 204
TABLE NO. 190. : Africa Flagship Smartphone Market Volume, By Distribution Channel, 2018 – 2023 (Units) 205
TABLE NO. 191. : Africa Flagship Smartphone Market Volume, By Distribution Channel, 2024 – 2032 (Units) 205
TABLE NO. 192. : Africa Flagship Smartphone Market Revenue, By Distribution Channel, 2018 – 2023 (USD Million) 206
TABLE NO. 193. : Africa Flagship Smartphone Market Revenue, By Distribution Channel, 2024 – 2032 (USD Million) 206