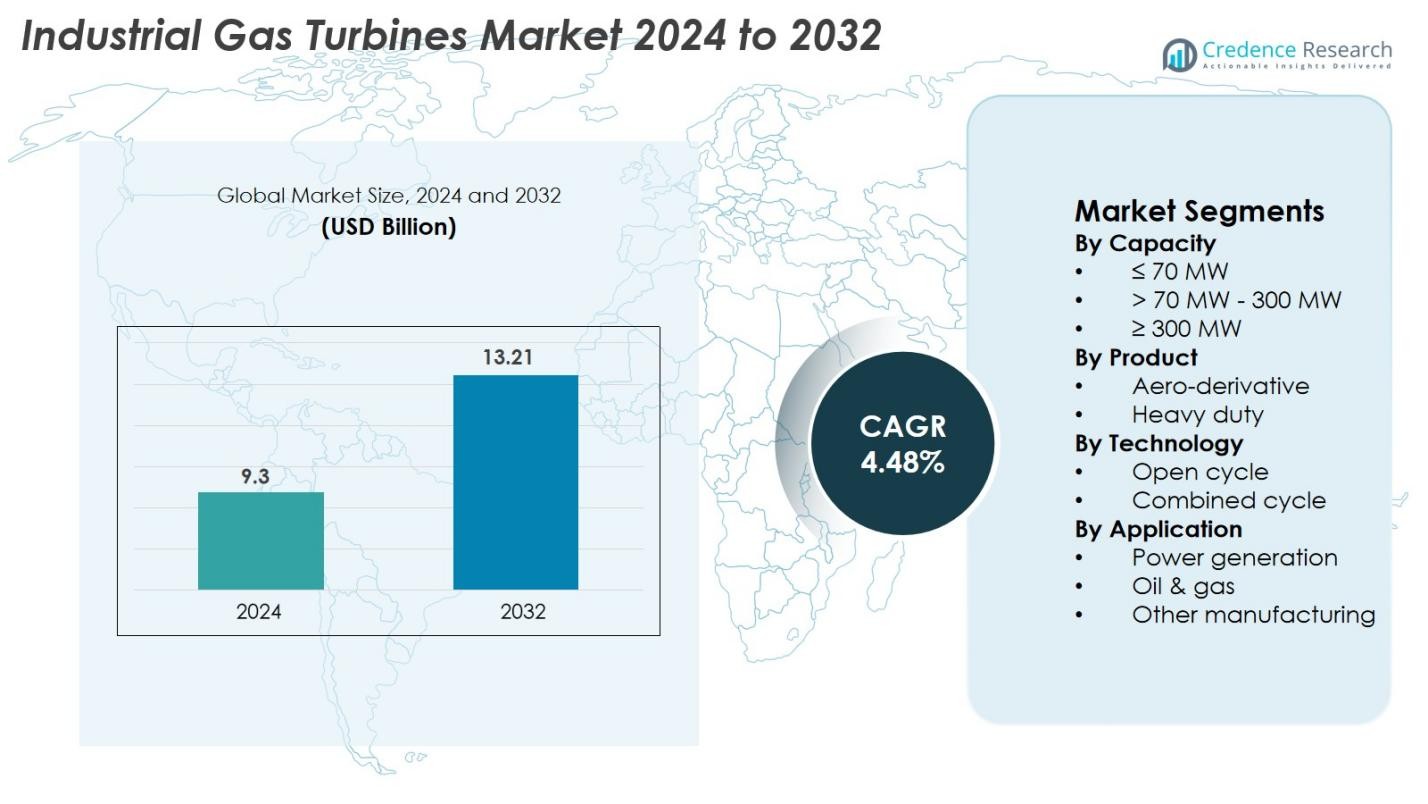
Home » Automotive & Transportation » Industrial Gas Turbines Market

Industrial Gas Turbines Market By Capacity (≤ 70 MW, > 70 MW – 300 MW, ≥ 300 MW) By Product (Aero-Derivative, Heavy Duty) By Technology (Open Cycle, Combined Cycle) – Growth, Share, Opportunities & Competitive Analysis, 2016 – 2028

Price: $4999

Published: | Report ID: 7534 | Report Format : PDF

About this report

The global Industrial Gas Turbines Market report explores the critical analysis of the industrial gas turbines industry using key parameters. The report consists of investment strategies, the need for investments in the industrial gas turbines industry, and the multiple benefits for the investors. Importantly, this report sets out major changes in the industrial gas turbine industry’s global technical regulations and how economic and non-economic barriers are helping the market grow. Moreover, the report examines historic and forecasted market sizes at the global, regional, and country levels. The report also includes an in-depth examination of key investment propositions, the demand and supply gap, competitor positioning, SRC analysis, STAR analysis, and Tornado analysis. Important technological advancements and other analyses, including Porter’s Five Forces, PESTEL, Value Chain, etc.

Automotive & Transportation

Key Highlights of the report

How are the major segments performing in the Industrial Gas Turbines Market?

The heavy-duty segment led the market in terms of product in 2021 and is expected to continue throughout the projection period. Heavy-duty gas turbines are an ideal fit for a variety of industrial applications due to benefits such as high performance and efficiency. New technological developments are expected to support significant growth in heavy-duty industrial gas turbines. An increase in product investments and restructured trade policies will pave the way for segment growth. For instance, GE announced the successful demonstration of its 7HA.03 heavy-duty gas turbines at Florida Power & Light’s (FPL) Dania Beach facility in June 2022.

In 2021, the ≥ 300 MW capacity segment led the global market due to the massive deployment of renewable energy systems supported by favorable government mandates. The large-scale implementation of advanced green energy systems will aid in producing natural gas-fired turbines and boilers. The majority of these large-capacity turbines are used in the power generation industry. Gas-powered units have a faster-operating speed, higher mechanical efficiency, improved reliability, and the ability to support distributed power generation.

In 2021, the combined cycle technology segment led the global market due to efficient waste heat utilization, environmental proximity, and operational efficiency. Turbines using combined cycle technology uses less fuel to produce the same amount of energy while eliminating transmission and distribution losses. Combined cycle turbines are extremely efficient, allowing systems to achieve 60 to 80 percent efficiencies. These units are used in land-based industries for mechanical and direct drive applications.

The oil and gas segment led the market in terms of application in 2021, and this trend is expected to continue throughout the forecast period. Increasing awareness of the dangers of traditional sources of electricity is hastening the adoption of sustainable energy systems, leading to high demand for industrial gas turbines in oil and gas applications. Industrial gas turbines are a valuable asset used in the oil and gas industry, and the growing market for cleaner assets in the sector is expected to increase the number of new installations of industrial gas turbines over the projected period.

Design Element 2

Access crucial information at unmatched prices!

Request your free sample report today & start making informed decisions powered by Credence Research!

Download Free Sample
CTA Design Element 3

Which region dominated the Industrial Gas Turbines Market?

The Asia Pacific region led the global industrial gas turbine market in 2021 owing to several factors, including rapid industrialization, rising energy demand, and rising interest in clean energy technology. Power generation in the Asia Pacific region is heavily reliant on coal. Increased R&D spending, rising technological development spending, and growing electricity consumption from countries such as Japan, China, and India drive regional industry growth. Moreover, the rapid evolution of the region’s electricity landscape is expected to lead to increased demand for the industry over the forecast period. The growing number of initiatives launched by the regional government to encourage more efficient methods of generating electricity is fueling growth prospects in the regional market.

What is the competitive environment of the Industrial Gas Turbines Market?

The global industrial gas turbine industry is segmented, with a large market player acquiring a significant portion. Several large corporations are forming numerous strategic alliances to increase their market share and gain a competitive advantage. The companies are primarily concerned with expanding their product portfolios through multiple business and infrastructure development initiatives. For instance, OPRA Turbines signed a contract with Quanta in June 2021. The collaboration enabled Quanta to become an OPRA Turbines reseller in the North Sea offshore oil & gas industry. On the other hand, Mitsubishi Power, a subsidiary of Mitsubishi Heavy Industries, was awarded a contract in March 2022 to develop two H-25 gas turbines with a total capacity of 32 MW. A natural gas-fired cogeneration power plant in Tashkent, Uzbekistan, will benefit from the project.

Executive Summary

What are all technical developments being developed in the Industrial Gas Turbines Market?

Technological advancements have played an important role in revolutionizing the industrial gas turbine market, and this trend is expected to continue throughout the forecast period. The aviation sector was at the forefront of innovation as aero-derivative technology entered the fray, marking a significant step forward in the power production sphere and important development in combined heat and power (CHP) generation. These advancements remain critical in balancing the integration of various power sources, such as solar and wind. Significant investments have been made to develop new mobile and improved industrial gas turbine models or units, as technological advancements continue to be critical for players in the industrial gas turbine market. Several companies have recently introduced cutting-edge industrial gas turbine models and technologies. For instance, ENGIE offered Emerson a contract to replace antiquated combustion turbine controls with modern turbine control methods as part of a project. In terms of technical innovation, GE has consistently remained at the forefront and leads the gas turbine market in developing innovative gas turbines. GE, for example, recently launched the DLN-2.6e combustion, in which fuel nozzles could influence pressure emissions, oscillations, and dynamic pressures.

Which are the key investments by the players in the Industrial Gas Turbines Market?

A massive change toward abundant natural gas resources and supportive government schemes and regulatory activities encourages grid infrastructure modernization. Significant investments in power network restructuring are being made to meet rising electricity demand. Governments worldwide are launching ambitious plans to include renewable energy sources in the mix of energy sources. Several investments and funds in renewable energy have been announced, which will help to meet the demand for additional power generation. For instance, the U.S. government announced plans to accelerate technology development in hydrogen and ammonia-fired gas turbines in May 2022. The initiative will invest $24.9 million to support six innovative industry-led projects. Similarly, GE received $4.2 million in federal funding in 2022 to develop new gas turbine technology projects. The project was funded by the U.S. Department of Energy’s Advanced Research Projects Agency-Energy (ARPA-E) OPEN 2021 program, which encourages novel approaches to clean energy challenges.

Some of the major players in the market are General Electric, Siemens Energy, Mitsubishi Heavy Industries, Wartsila, Harbin Electric Corporation, Bharat Heavy Electricals Limited, VERICOR, MAN Energy Solutions, Kawasaki Heavy Industries, Opra Turbines, Solar Turbines Incorporated, UEC-Saturn, and Baker Hughes Company.

What are the Major Driving Factors for the Industrial Gas Turbines Market?

Rapid technological advancements in the energy industry, combined with a shift in emphasis toward distributed power production technologies, are expected to drive industry growth over the forecast period. Integrating product technology into other systems to provide innovative solutions increases market demand. Moreover, the growing government initiatives toward technology development, combined with the increasing need to address the strong demand for energy decarbonization around the world, is significantly leading to higher growth prospects for the industry.

What are the Major Risks for the Industrial Gas Turbines Market?

Volatile natural gas prices impede the market growth. Natural gas prices are influenced by actions that have the potential to disrupt the natural gas supply. Global geopolitical tensions are disruptive, causing uncertainty about gas supply and demand. Lack of expertise in industrial gas turbine installation and below-average labor safety laws may also limit the true potential of the industrial gas turbine market. Other implementation risk factors, such as increased fuel consumption while idling and a preference for a constant load over a variable load, are expected to limit market growth to some extent. Furthermore, the combustion chamber temperature is too high, leading to a shorter life, which impedes market revenue growth over the forecast period.

Which is the key Application in the Industrial Gas Turbines Market?

In terms of application, the oil and gas segment led the market in 2021, and this trend is expected to continue throughout the forecast period. Industrial gas turbines are in high demand in oil and gas applications due to growing awareness of the risks associated with conventional electricity sources and the accelerated adoption of sustainable energy systems. Industrial gas turbines are a valuable asset used in the oil and gas industry, and over the projected period, the number of new installations of industrial gas turbines is anticipated to rise in response to the sector’s expanding demand for cleaner assets. Oil and gas turbine plants are commonly used as medium-sized peak load plants that run intermittently during brief periods of high-power demand on an electric grid. Additionally, they serve as cogeneration units for district heating systems and industrial facilities with high heat loads. Oil and gas companies produce shale gas using advanced technology completion techniques such as multistage hydraulic fracturing and drilling techniques such as horizontal wellbores. Gas turbines demonstrate a cost-effective and efficient power distribution solution in plants.

How is the Industrial Gas Turbines Market performing in regions?

The Asia Pacific dominated the global industrial gas turbine market in 2021 and is expected to continue this dominant position over the forecast period. This is due to the expansion of the gas turbine market in the Asia Pacific, as well as increased electricity consumption and subsequent investments in developing new large gas-fired combined cycle power plants generation, which has fueled demand for industrial gas turbines in the region. To reduce greenhouse gas emissions, the use of gas for transportation and power generation has significantly increased in the area. Another factor driving growth is the installation of new power plants in various emerging economies and the region’s rapid urbanization, industrialization, and economic expansion.

Besides, North America is expected to grow the most during the forecast period due to shale gas reserves, and the development of new extraction and mining technologies is lowering the operational costs of gas extraction in the region. Moreover, large-scale gas-based power plant commissioning has occurred in North America. Oil and gas companies commercially produce shale gas using advanced completion techniques such as multistage hydraulic fracturing and drilling techniques like horizontal wellbores. The rising demand for clean electricity by prescribed norms and regulatory policies imposed by governing bodies in countries such as the United States is expected to propel market growth. Furthermore, the region’s emerging shale revolution is expected to drive the market demand for industrial gas turbines.

What is the regulatory landscape for the Industrial Gas Turbines Market?

As environmental awareness rises, there is a growing global consumer preference for energy-efficient technologies. Aggressive regulatory targets for carbon emission reduction in the EU are being implemented by government agencies worldwide, which may result in a rise in the use of natural gas as a source of industrial energy. Due to mounting regulatory pressure and environmental concerns, natural gas continues to rise in popularity among power producers worldwide as a reliable fuel of choice. Participants in the industrial gas turbine market are expected to keep up with these developments while power producers continue to invest in new technologies in tandem with the changing industrial and regulatory requirements. Key players in the industrial gas turbine market are concentrating primarily on increasing the reliability of their products and reducing carbon emissions. CHP plant is an example of a combined cycle power plant that can be used to generate electricity as well as provide mechanical drive. The market in the United States is expected to grow due to increased government support for power generation technologies aimed at reducing carbon dioxide (CO2) emissions. According to the Energy Information Administration, with a 38% share of the sources of U.S. power generation, natural gas was the country’s top source of electricity generation in 2019. Long-term fuel supply assurance is being observed in the United States. Gas turbines are critical in lowering greenhouse gas (GHG) emissions. These are more efficient than other combustion-based electricity generation applications and result in lower carbon emissions.

What is the Market Size of the Industrial Gas Turbines regarding value?

The global industrial gas turbine market is anticipated to grow at a substantial CAGR of 5.6% in the upcoming years. The global industrial gas turbines industry was estimated to be worth USD 5.5 billion in 2021 and was expected to be worth USD 7.62 billion by 2028.

Shape Your Report to Specific Countries or Regions & Enjoy 30% Off!

What are the major players planning for the future of the Industrial Gas Turbines Market?

One of the key trends that will gain traction in the global industrial gas turbine market during the forecast period is the increase in cogeneration. Producing both heat and electricity at the same time is known as cogeneration. This technique is becoming more popular in food processing, chemicals, and metal manufacturing industries since it reduces GHG emissions. The future extent of cogeneration in these sectors will directly impact the market’s expansion. Currently, clean hydrogen generated from natural gas using carbon capture, utilization, and sequestration (CCUS) technology allows companies like Mitsubishi Power to access clean fuel while future infrastructure is developed and scaled. For instance, Mitsubishi Power received contracts from Taiwan Power in 2022 for the large-scale overhaul of four industrial gas turbine combined cycle (GTCC) power plants (Units 3–6), totaling eight gas turbines. The project aimed to reduce nitrogen oxide (NOx) emissions while maintaining generating capacity, allowing the plant to comply with increasingly stringent environmental regulations and improving operational flexibility through improved operations and maintenance (O&M).

Segmentation of Global Industrial Gas Turbines Market –

Global Industrial Gas Turbines Market – By Capacity

  • ≤ 70 MW
  • > 70 MW – 300 MW
  • ≥ 300 MW

Global Industrial Gas Turbines Market – By Product

  • Aero-Derivative
  • Heavy Duty

Global Industrial Gas Turbines Market – By Technology

  • Open Cycle
  • Combined Cycle

Global Industrial Gas Turbines Market – By Application

  • Power Generation
  • Oil & Gas
  • Other Manufacturing

Global Industrial Gas Turbines Market – By Region

  • North America
    • The U.S.
    • Canada
  • Europe
    • Germany
    • France
    • The U.K.
    • Italy
    • Spain
    • Rest of Europe
  • Asia Pacific
    • China
    • Japan
    • India
    • South Korea
    • South-east Asia
    • Rest of Asia Pacific
  • Latin America
    • Brazil
    • Mexico
    • Rest of Latin America
  • Middle East & Africa
    • GCC Countries
    • South Africa
    • Rest of the Middle East and Africa

1. Preface
1.1. Report Description
1.1.1. Purpose of the Report
1.1.2. Target Audience
1.1.3. USP and Key Offerings
1.2. Research Scope
1.3. Research Methodology
1.3.1. Phase I – Secondary Research
1.3.2. Phase II – Primary Research
1.3.3. Phase III – Expert Panel Review
1.3.4. Approach Adopted
1.3.4.1. Top-Down Approach
1.3.4.2. Bottom-Up Approach
1.3.5. Assumptions
1.4. Market Segmentation

2. Executive Summary
2.1. Market Snapshot: Global Industrial Gas Turbines Market
2.2. Global Industrial Gas Turbines Market, By Capacity
2.3. Global Industrial Gas Turbines Market, By Product
2.4. Global Industrial Gas Turbines Market, By Technology
2.5. Global Industrial Gas Turbines Market, By Application
2.6. Global Industrial Gas Turbines Market, By Region

3. Market Dynamics & Factors Analysis
3.1. Introduction
3.1.1. Global Industrial Gas Turbines Market Value, 2016-2028, (US$ Bn)
3.2. Market Dynamics
3.2.1. Key Growth Trends
3.2.2. Market Drivers
3.2.3. Market Restraints
3.2.4. Market Opportunities
3.2.5. Major Industry Challenges
3.3. Attractive Investment Proposition,2021
3.3.1. Capacity
3.3.2. Product
3.3.3. Technology
3.3.4. Application
3.3.5. Geography

4. Premium Insights
4.1. STAR (Situation, Task, Action, Results) Analysis
4.2. Porter’s Five Forces Analysis
4.2.1. Threat of New Entrants
4.2.2. Bargaining Power of Buyers/Consumers
4.2.3. Bargaining Power of Suppliers
4.2.4. Threat of Substitute Types
4.2.5. Intensity of Competitive Rivalry
4.3. Value Chain Analysis
4.4. Technology Analysis
4.5. Marketing Strategy Analysis
4.5.1. Direct Marketing
4.5.2. Indirect Marketing
4.5.3. Marketing Channel Development Trend

5. Market Positioning of Key Players, 2021

5.1. Company market share of key players, 2021
5.2. Competitive Benchmarking
5.3. Market Positioning of Key Vendors
5.4. Geographical Presence Analysis
5.5. Major Strategies Adopted by Key Players
5.5.1. Key Strategies Analysis
5.5.2. Mergers and Acquisitions
5.5.3. Partnerships
5.5.4. Product Launch
5.5.5. Geographical Expansion
5.5.6. Others

6. COVID 19 Impact Analysis
6.1. Global Industrial Gas Turbines Market Pre Vs Post COVID 19, 2019 – 2028
6.2. Impact on Import & Export
6.3. Impact on Demand & Supply

7. Global Industrial Gas Turbines Market
7.1. Global Industrial Gas Turbines Market, by Capacity, 2016-2028(US$ Bn)
7.1.1. Overview
7.1.2. Global Industrial Gas Turbines Market, By Capacity, 2021 vs 2028 (in%)
7.1.3. Global Industrial Gas Turbines Market, By ≤ 70 MW, 2016-2028 (US$ Bn)
7.1.4. Global Industrial Gas Turbines Market, By > 70 MW – 300 MW, 2016-2028 (US$ Bn)
7.1.5. Global Industrial Gas Turbines Market, By ≥ 300 MW, 2016-2028 (US$ Bn)
7.2. Global Industrial Gas Turbines Market, by Product, 2016-2028(US$ Bn)
7.2.1. Overview
7.2.2. Global Industrial Gas Turbines Market, By Product, 2021 vs 2028 (in%)
7.2.3. Global Industrial Gas Turbines Market, By Aero-Derivative, 2016-2028 (US$ Bn)
7.2.4. Global Industrial Gas Turbines Market, By Heavy Duty, 2016-2028 (US$ Bn)
7.3. Global Industrial Gas Turbines Market, by Technology, 2016-2028(US$ Bn)
7.3.1. Overview
7.3.2. Global Industrial Gas Turbines Market, By Technology, 2021 vs 2028 (in%)
7.3.3. Global Industrial Gas Turbines Market, By Open Cycle, 2016-2028 (US$ Bn)
7.3.4. Global Industrial Gas Turbines Market, By Combined Cycle, 2016-2028 (US$ Bn)
7.4. Global Industrial Gas Turbines Market, by Application, 2016-2028(US$ Bn)
7.4.1. Overview
7.4.2. Global Industrial Gas Turbines Market, By Application, 2021 vs 2028 (in%)
7.4.3. Global Industrial Gas Turbines Market, By Power Generation, 2016-2028 (US$ Bn)
7.4.4. Global Industrial Gas Turbines Market, By Oil & Gas, 2016-2028 (US$ Bn)
7.4.5. Global Industrial Gas Turbines Market, By Other Manufacturing, 2016-2028 (US$ Bn)

8. North America Industrial Gas Turbines Market Analysis
8.1. North America Industrial Gas Turbines Market, by Capacity, 2016-2028(US$ Bn)
8.1.1. Overview
8.1.2. SRC Analysis
8.2. North America Industrial Gas Turbines Market, by Product, 2016-2028(US$ Bn)
8.2.1. Overview
8.2.2. SRC Analysis
8.3. North America Industrial Gas Turbines Market, by Technology, 2016-2028(US$ Bn)
8.3.1. Overview
8.3.2. SRC Analysis
8.4. North America Industrial Gas Turbines Market, by Application, 2016-2028(US$ Bn)
8.4.1. Overview
8.4.2. SRC Analysis
8.5. North America Industrial Gas Turbines Market, by Country, 2016-2028 (US$ Bn)
8.5.1. U.S.
8.5.1.1. U.S. Industrial Gas Turbines Market Estimates and Forecast, 2016-2028 (US$ Bn)
8.5.1.2. U.S. Industrial Gas Turbines, By Capacity, 2016-2028 (US$ Bn)
8.5.1.3. U.S. Industrial Gas Turbines, By Product, 2016-2028 (US$ Bn)
8.5.1.4. U.S. Industrial Gas Turbines, By Technology, 2016-2028 (US$ Bn)
8.5.1.5. U.S. Industrial Gas Turbines, By Application, 2016-2028 (US$ Bn)
8.5.2. Canada
8.5.2.1. Canada Industrial Gas Turbines Market Estimates and Forecast, 2016-2028 (US$ Bn)
8.5.2.2. Canada Industrial Gas Turbines, By Capacity, 2016-2028 (US$ Bn)
8.5.2.3. Canada Industrial Gas Turbines, By Product, 2016-2028 (US$ Bn)
8.5.2.4. Canada Industrial Gas Turbines, By Technology, 2016-2028 (US$ Bn)
8.5.2.5. Canada Industrial Gas Turbines, By Application, 2016-2028 (US$ Bn)

9. Europe Industrial Gas Turbines Market Analysis
9.1. Europe Industrial Gas Turbines Market, by Capacity, 2016-2028(US$ Bn)
9.1.1. Overview
9.1.2. SRC Analysis
9.2. Europe Industrial Gas Turbines Market, by Product, 2016-2028(US$ Bn)
9.2.1. Overview
9.2.2. SRC Analysis
9.3. Europe Industrial Gas Turbines Market, by Technology, 2016-2028(US$ Bn)
9.3.1. Overview
9.3.2. SRC Analysis
9.4. Europe Industrial Gas Turbines Market, by Application, 2016-2028(US$ Bn)
9.4.1. Overview
9.4.2. SRC Analysis
9.5. Europe Industrial Gas Turbines Market, by Country, 2016-2028 (US$ Bn)
9.5.1. Germany
9.5.1.1. Germany Industrial Gas Turbines Market Estimates and Forecast, 2016-2028 (US$ Bn)
9.5.1.2. Germany Industrial Gas Turbines, By Capacity, 2016-2028 (US$ Bn)
9.5.1.3. Germany Industrial Gas Turbines, By Product, 2016-2028 (US$ Bn)
9.5.1.4. Germany Industrial Gas Turbines, By Technology, 2016-2028 (US$ Bn)
9.5.1.5. Germany Industrial Gas Turbines, By Application, 2016-2028 (US$ Bn)
9.5.2. France
9.5.2.1. France Industrial Gas Turbines Market Estimates and Forecast, 2016-2028 (US$ Bn)
9.5.2.2. France Industrial Gas Turbines, By Capacity, 2016-2028 (US$ Bn)
9.5.2.3. France Industrial Gas Turbines, By Product, 2016-2028 (US$ Bn)
9.5.2.4. France Industrial Gas Turbines, By Technology, 2016-2028 (US$ Bn)
9.5.2.5. France Industrial Gas Turbines, By Application, 2016-2028 (US$ Bn)
9.5.3. UK
9.5.3.1. UK Industrial Gas Turbines Market Estimates and Forecast, 2016-2028 (US$ Bn)
9.5.3.2. UK Industrial Gas Turbines, By Capacity, 2016-2028 (US$ Bn)
9.5.3.3. UK Industrial Gas Turbines, By Product, 2016-2028 (US$ Bn)
9.5.3.4. UK Industrial Gas Turbines, By Technology, 2016-2028 (US$ Bn)
9.5.3.5. UK Industrial Gas Turbines, By Application, 2016-2028 (US$ Bn)
9.5.4. Italy
9.5.4.1. Italy Industrial Gas Turbines Market Estimates and Forecast, 2016-2028 (US$ Bn)
9.5.4.2. Italy Industrial Gas Turbines, By Capacity, 2016-2028 (US$ Bn)
9.5.4.3. Italy Industrial Gas Turbines, By Product, 2016-2028 (US$ Bn)
9.5.4.4. Italy Industrial Gas Turbines, By Technology, 2016-2028 (US$ Bn)
9.5.4.5. Italy Industrial Gas Turbines, By Application, 2016-2028 (US$ Bn)
9.5.5. Spain
9.5.5.1. Spain Industrial Gas Turbines Market Estimates and Forecast, 2016-2028 (US$ Bn)
9.5.5.2. Spain Industrial Gas Turbines, By Capacity, 2016-2028 (US$ Bn)
9.5.5.3. Spain Industrial Gas Turbines, By Product, 2016-2028 (US$ Bn)
9.5.5.4. Spain Industrial Gas Turbines, By Technology, 2016-2028 (US$ Bn)
9.5.5.5. Spain Industrial Gas Turbines, By Application, 2016-2028 (US$ Bn)
9.5.6. Rest of Europe
9.5.6.1. Rest of Europe Industrial Gas Turbines Market Estimates and Forecast, 2016-2028 (US$ Bn)
9.5.6.2. Rest of Europe Industrial Gas Turbines, By Capacity, 2016-2028 (US$ Bn)
9.5.6.3. Rest of Europe Industrial Gas Turbines, By Product, 2016-2028 (US$ Bn)
9.5.6.4. Rest of Europe Industrial Gas Turbines, By Technology, 2016-2028 (US$ Bn)
9.5.6.5. Rest of Europe Industrial Gas Turbines, By Application, 2016-2028 (US$ Bn)

10. Asia Pacific Industrial Gas Turbines Market Analysis
10.1. Asia Pacific Industrial Gas Turbines Market, by Capacity, 2016-2028(US$ Bn)
10.1.1. Overview
10.1.2. SRC Analysis
10.2. Asia Pacific Industrial Gas Turbines Market, by Product, 2016-2028(US$ Bn)
10.2.1. Overview
10.2.2. SRC Analysis
10.3. Asia Pacific Industrial Gas Turbines Market, by Technology, 2016-2028(US$ Bn)
10.3.1. Overview
10.3.2. SRC Analysis
10.4. Asia Pacific Industrial Gas Turbines Market, by Application, 2016-2028(US$ Bn)
10.4.1. Overview
10.4.2. SRC Analysis
10.5. Asia Pacific Industrial Gas Turbines Market, by Country, 2016-2028 (US$ Bn)
10.5.1. China
10.5.1.1. China Industrial Gas Turbines Market Estimates and Forecast, 2016-2028 (US$ Bn)
10.5.1.2. China Industrial Gas Turbines, By Capacity, 2016-2028 (US$ Bn)
10.5.1.3. China Industrial Gas Turbines, By Product, 2016-2028 (US$ Bn)
10.5.1.4. China Industrial Gas Turbines, By Technology, 2016-2028 (US$ Bn)
10.5.1.5. China Industrial Gas Turbines, By Application, 2016-2028 (US$ Bn)
10.5.2. Japan
10.5.2.1. Japan Industrial Gas Turbines Market Estimates and Forecast, 2016-2028 (US$ Bn)
10.5.2.2. Japan Industrial Gas Turbines, By Capacity, 2016-2028 (US$ Bn)
10.5.2.3. Japan Industrial Gas Turbines, By Product, 2016-2028 (US$ Bn)
10.5.2.4. Japan Industrial Gas Turbines, By Technology, 2016-2028 (US$ Bn)
10.5.2.5. Japan Industrial Gas Turbines, By Application, 2016-2028 (US$ Bn)
10.5.3. India
10.5.3.1. India Industrial Gas Turbines Market Estimates and Forecast, 2016-2028 (US$ Bn)
10.5.3.2. India Industrial Gas Turbines, By Capacity, 2016-2028 (US$ Bn)
10.5.3.3. India Industrial Gas Turbines, By Product, 2016-2028 (US$ Bn)
10.5.3.4. India Industrial Gas Turbines, By Technology, 2016-2028 (US$ Bn)
10.5.3.5. India Industrial Gas Turbines, By Application, 2016-2028 (US$ Bn)
10.5.4. South Korea
10.5.4.1. South Korea Industrial Gas Turbines Market Estimates and Forecast, 2016-2028 (US$ Bn)
10.5.4.2. South Korea Industrial Gas Turbines, By Capacity, 2016-2028 (US$ Bn)
10.5.4.3. South Korea Industrial Gas Turbines, By Product, 2016-2028 (US$ Bn)
10.5.4.4. South Korea Industrial Gas Turbines, By Technology, 2016-2028 (US$ Bn)
10.5.4.5. South Korea Industrial Gas Turbines, By Application, 2016-2028 (US$ Bn)
10.5.5. South-East Asia
10.5.5.1. South-East Asia Industrial Gas Turbines Market Estimates and Forecast, 2016-2028 (US$ Bn)
10.5.5.2. South-East Asia Industrial Gas Turbines, By Capacity, 2016-2028 (US$ Bn)
10.5.5.3. South-East Asia Industrial Gas Turbines, By Product, 2016-2028 (US$ Bn)
10.5.5.4. South-East Asia Industrial Gas Turbines, By Technology, 2016-2028 (US$ Bn)
10.5.5.5. South-East Asia Industrial Gas Turbines, By Application, 2016-2028 (US$ Bn)
10.5.6. Rest of Asia Pacific
10.5.6.1. Rest of Asia Pacific Industrial Gas Turbines Market Estimates and Forecast, 2016-2028 (US$ Bn)
10.5.6.2. Rest of Asia Pacific Industrial Gas Turbines, By Capacity, 2016-2028 (US$ Bn)
10.5.6.3. Rest of Asia Pacific Industrial Gas Turbines, By Product, 2016-2028 (US$ Bn)
10.5.6.4. Rest of Asia Pacific Industrial Gas Turbines, By Technology, 2016-2028 (US$ Bn)
10.5.6.5. Rest of Asia Pacific Industrial Gas Turbines, By Application, 2016-2028 (US$ Bn)

11. Latin America Industrial Gas Turbines Market Analysis
11.1. Latin America Industrial Gas Turbines Market, by Capacity, 2016-2028(US$ Bn)
11.1.1. Overview
11.1.2. SRC Analysis
11.2. Latin America Industrial Gas Turbines Market, by Product, 2016-2028(US$ Bn)
11.2.1. Overview
11.2.2. SRC Analysis
11.3. Latin America Industrial Gas Turbines Market, by Technology, 2016-2028(US$ Bn)
11.3.1. Overview
11.3.2. SRC Analysis
11.4. Latin America Industrial Gas Turbines Market, by Application, 2016-2028(US$ Bn)
11.4.1. Overview
11.4.2. SRC Analysis
11.5. Latin America Industrial Gas Turbines Market, by Country, 2016-2028 (US$ Bn)
11.5.1. Brazil
11.5.1.1. Brazil Industrial Gas Turbines Market Estimates and Forecast, 2016-2028 (US$ Bn)
11.5.1.2. Brazil Industrial Gas Turbines, By Capacity, 2016-2028 (US$ Bn)
11.5.1.3. Brazil Industrial Gas Turbines, By Product, 2016-2028 (US$ Bn)
11.5.1.4. Brazil Industrial Gas Turbines, By Technology, 2016-2028 (US$ Bn)
11.5.1.5. Brazil Industrial Gas Turbines, By Application, 2016-2028 (US$ Bn)
11.5.2. Mexico
11.5.2.1. Mexico Industrial Gas Turbines Market Estimates and Forecast, 2016-2028 (US$ Bn)
11.5.2.2. Mexico Industrial Gas Turbines, By Capacity, 2016-2028 (US$ Bn)
11.5.2.3. Mexico Industrial Gas Turbines, By Product, 2016-2028 (US$ Bn)
11.5.2.4. Mexico Industrial Gas Turbines, By Technology, 2016-2028 (US$ Bn)
11.5.2.5. Mexico Industrial Gas Turbines, By Application, 2016-2028 (US$ Bn)
11.5.3. Rest of Latin America
11.5.3.1. Rest of Latin America Industrial Gas Turbines Market Estimates and Forecast, 2016-2028 (US$ Bn)
11.5.3.2. Rest of Latin America Industrial Gas Turbines, By Capacity, 2016-2028 (US$ Bn)
11.5.3.3. Rest of Latin America Industrial Gas Turbines, By Product, 2016-2028 (US$ Bn)
11.5.3.4. Rest of Latin America Industrial Gas Turbines, By Technology, 2016-2028 (US$ Bn)
11.5.3.5. Rest of Latin America Industrial Gas Turbines, By Application, 2016-2028 (US$ Bn)

12. Middle East and Africa Industrial Gas Turbines Market Analysis
12.1. Middle East and Africa Industrial Gas Turbines Market, by Capacity, 2016-2028(US$ Bn)
12.1.1. Overview
12.1.2. SRC Analysis
12.2. Middle East and Africa Industrial Gas Turbines Market, by Product, 2016-2028(US$ Bn)
12.2.1. Overview
12.2.2. SRC Analysis
12.3. Middle East and Africa Industrial Gas Turbines Market, by Technology, 2016-2028(US$ Bn)
12.3.1. Overview
12.3.2. SRC Analysis
12.4. Middle East and Africa Industrial Gas Turbines Market, by Application, 2016-2028(US$ Bn)
12.4.1. Overview
12.4.2. SRC Analysis
12.5. Middle East and Africa Industrial Gas Turbines Market, by Country, 2016-2028 (US$ Bn)
12.5.1. GCC Countries
12.5.1.1. GCC Countries Industrial Gas Turbines Market Estimates and Forecast, 2016-2028 (US$ Bn)
12.5.1.2. GCC Countries Industrial Gas Turbines, By Capacity, 2016-2028 (US$ Bn)
12.5.1.3. GCC Countries Industrial Gas Turbines, By Product, 2016-2028 (US$ Bn)
12.5.1.4. GCC Countries Industrial Gas Turbines, By Technology, 2016-2028 (US$ Bn)
12.5.1.5. GCC Countries Industrial Gas Turbines, By Application, 2016-2028 (US$ Bn)
12.5.2. South Africa
12.5.2.1. South Africa Industrial Gas Turbines Market Estimates and Forecast, 2016-2028 (US$ Bn)
12.5.2.2. South Africa Industrial Gas Turbines, By Capacity, 2016-2028 (US$ Bn)
12.5.2.3. South Africa Industrial Gas Turbines, By Product, 2016-2028 (US$ Bn)
12.5.2.4. South Africa Industrial Gas Turbines, By Technology, 2016-2028 (US$ Bn)
12.5.2.5. South Africa Industrial Gas Turbines, By Application, 2016-2028 (US$ Bn)
12.5.3. Rest of Middle East and Africa
12.5.3.1. Rest of Middle East and Africa Industrial Gas Turbines Market Estimates and Forecast, 2016-2028 (US$ Bn)
12.5.3.2. Rest of Middle East and Africa Industrial Gas Turbines, By Capacity, 2016-2028 (US$ Bn)
12.5.3.3. Rest of Middle East and Africa Industrial Gas Turbines, By Product, 2016-2028 (US$ Bn)
12.5.3.4. Rest of Middle East and Africa Industrial Gas Turbines, By Technology, 2016-2028 (US$ Bn)
12.5.3.5. Rest of Middle East and Africa Industrial Gas Turbines, By Application, 2016-2028 (US$ Bn)

13. Company Profiles
13.1. General Electric
13.1.1. Company Overview
13.1.2. Products/Services Portfolio
13.1.3. Geographical Presence
13.1.4. Financial Summary
13.1.4.1. Market Revenue and Net Profit (2019-2021)
13.1.4.2. Business Segment Revenue Analysis
13.1.4.3. Geographical Revenue Analysis
13.2. Siemens Energy
13.3. Mitsubishi Heavy Industries
13.4. Wartsila
13.5. Harbin Electric Corporation
13.6. Bharat Heavy Electricals Ltd
13.7. Vericor
13.8. Kawasaki Heavy Industries
13.9. Opra Turbines
13.10. Solar Turbines Incorporated
13.11. UEC-Saturn
13.12. Baker Hughes Company
13.13. Nanjing Turbine & Electric Machinery
13.14. Ansaldo Energia
13.15. Others

List of Figures

FIG. 1 Global Industrial Gas Turbines Market: Research Methodology
FIG. 2 Market Size Estimation – Top Down & Bottom up Approach
FIG. 3 Global Industrial Gas Turbines Market Segmentation
FIG. 4 Global Industrial Gas Turbines Market, by Capacity, 2021 (US$ Bn)
FIG. 5 Global Industrial Gas Turbines Market, by Product, 2021 (US$ Bn)
FIG. 6 Global Industrial Gas Turbines Market, by Technology, 2021 (US$ Bn)
FIG. 7 Global Industrial Gas Turbines Market, by Application, 2021 (US$ Bn)
FIG. 8 Global Industrial Gas Turbines Market, by Geography, 2021 (US$ Bn)
FIG. 9 Attractive Investment Proposition, by Capacity, 2021
FIG. 10 Attractive Investment Proposition, by Product, 2021
FIG. 11 Attractive Investment Proposition, by Technology, 2021
FIG. 12 Attractive Investment Proposition, by Application, 2021
FIG. 13 Attractive Investment Proposition, by Geography, 2021
FIG. 14 Global Market Share Analysis of Key Industrial Gas Turbines Market Manufacturers, 2021
FIG. 15 Global Market Positioning of Key Industrial Gas Turbines Market Manufacturers, 2021
FIG. 16 Global Industrial Gas Turbines Market Value Contribution, By Capacity, 2021 & 2028 (Value %)
FIG. 17 Global Industrial Gas Turbines Market, by ≤ 70 MW, Value, 2016-2028 (US$ Bn)
FIG. 18 Global Industrial Gas Turbines Market, by > 70 MW – 300 MW, Value, 2016-2028 (US$ Bn)
FIG. 19 Global Industrial Gas Turbines Market, by ≥ 300 MW, Value, 2016-2028 (US$ Bn)
FIG. 20 Global Industrial Gas Turbines Market Value Contribution, By Product, 2021 & 2028 (Value %)
FIG. 21 Global Industrial Gas Turbines Market, by Aero-Derivative, Value, 2016-2028 (US$ Bn)
FIG. 22 Global Industrial Gas Turbines Market, by Heavy Duty, Value, 2016-2028 (US$ Bn)
FIG. 23 Global Industrial Gas Turbines Market Value Contribution, By Technology, 2021 & 2028 (Value %)
FIG. 24 Global Industrial Gas Turbines Market, by Open Cycle, Value, 2016-2028 (US$ Bn)
FIG. 25 Global Industrial Gas Turbines Market, by Combined Cycle, Value, 2016-2028 (US$ Bn)
FIG. 26 Global Industrial Gas Turbines Market Value Contribution, By Application, 2021 & 2028 (Value %)
FIG. 27 Global Industrial Gas Turbines Market, by Power Generation, Value, 2016-2028 (US$ Bn)
FIG. 28 Global Industrial Gas Turbines Market, by Oil & Gas, Value, 2016-2028 (US$ Bn)
FIG. 29 Global Industrial Gas Turbines Market, by Other Manufacturing, Value, 2016-2028 (US$ Bn)
FIG. 30 U.S. Industrial Gas Turbines Market, 2016-2028 (US$ Bn)
FIG. 31 Canada Industrial Gas Turbines Market, 2016-2028 (US$ Bn)
FIG. 32 Germany Industrial Gas Turbines Market, 2016-2028 (US$ Bn)
FIG. 33 France Industrial Gas Turbines Market, 2016-2028 (US$ Bn)
FIG. 34 U.K. Industrial Gas Turbines Market, 2016-2028 (US$ Bn)
FIG. 35 Italy Industrial Gas Turbines Market, 2016-2028 (US$ Bn)
FIG. 36 Spain Industrial Gas Turbines Market, 2016-2028 (US$ Bn)
FIG. 37 Rest of Europe Industrial Gas Turbines Market, 2016-2028 (US$ Bn)
FIG. 38 China Industrial Gas Turbines Market, 2016-2028 (US$ Bn)
FIG. 39 Japan Industrial Gas Turbines Market, 2016-2028 (US$ Bn)
FIG. 40 India Industrial Gas Turbines Market, 2016-2028 (US$ Bn)
FIG. 41 South Korea Industrial Gas Turbines Market, 2016-2028 (US$ Bn)
FIG. 42 Southeast Asia Industrial Gas Turbines Market, 2016-2028 (US$ Bn)
FIG. 43 Rest of Asia Pacific Industrial Gas Turbines Market, 2016-2028 (US$ Bn)
FIG. 44 Latin America Industrial Gas Turbines Market, 2016-2028 (US$ Bn)
FIG. 45 Brazil Industrial Gas Turbines Market, 2016-2028 (US$ Bn)
FIG. 46 Mexico Industrial Gas Turbines Market, 2016-2028 (US$ Bn)
FIG. 47 Rest of Latin America Industrial Gas Turbines Market, 2016-2028 (US$ Bn)
FIG. 48 Middle East & Africa Industrial Gas Turbines Market, 2016-2028 (US$ Bn)
FIG. 49 GCC Countries Industrial Gas Turbines Market, 2016-2028 (US$ Bn)
FIG. 50 South Africa Industrial Gas Turbines Market, 2016-2028 (US$ Bn)
FIG. 51 Rest of Middle East and Africa Industrial Gas Turbines Market, 2016-2028 (US$ Bn)

List of Tables

TABLE 1 Market Snapshot: Global Industrial Gas Turbines Market
TABLE 2 Global Industrial Gas Turbines Market, by Competitive Benchmarking, 2021
TABLE 3 Global Industrial Gas Turbines Market, by Geographical Presence Analysis, 2021
TABLE 4 Global Industrial Gas Turbines Market, by Key Strategies Analysis, 2021
TABLE 5 Global Industrial Gas Turbines Market, by Capacity, 2016-2028 (US$ Bn)
TABLE 6 Global Industrial Gas Turbines Market, by Product, 2016-2028 (US$ Bn)
TABLE 7 Global Industrial Gas Turbines Market, by Technology, 2016-2028 (US$ Bn)
TABLE 8 Global Industrial Gas Turbines Market, by Application, 2016-2028 (US$ Bn)
TABLE 9 Global Industrial Gas Turbines Market, by Geography, 2016-2028 (US$ Bn)
TABLE 10 North America Industrial Gas Turbines Market, by Capacity, 2016-2028 (US$ Bn)
TABLE 11 North America Industrial Gas Turbines Market, by Product, 2016-2028 (US$ Bn)
TABLE 12 North America Industrial Gas Turbines Market, by Technology, 2016-2028 (US$ Bn)
TABLE 13 North America Industrial Gas Turbines Market, by Application, 2016-2028 (US$ Bn)
TABLE 14 North America Industrial Gas Turbines Market, by Country, 2016-2028 (US$ Bn)
TABLE 15 US Industrial Gas Turbines Market, by Capacity, 2016-2028 (US$ Bn)
TABLE 16 US Industrial Gas Turbines Market, by Product, 2016-2028 (US$ Bn)
TABLE 17 US Industrial Gas Turbines Market, by Technology, 2016-2028 (US$ Bn)
TABLE 18 US Industrial Gas Turbines Market, by Application, 2016-2028 (US$ Bn)
TABLE 19 Canada Industrial Gas Turbines Market, by Capacity, 2016-2028 (US$ Bn)
TABLE 20 Canada Industrial Gas Turbines Market, by Product, 2016-2028 (US$ Bn)
TABLE 21 Canada Industrial Gas Turbines Market, by Technology, 2016-2028 (US$ Bn)
TABLE 22 Canada Industrial Gas Turbines Market, by Application, 2016-2028 (US$ Bn)
TABLE 23 Europe Industrial Gas Turbines Market, by Capacity, 2016-2028 (US$ Bn)
TABLE 24 Europe Industrial Gas Turbines Market, by Product, 2016-2028 (US$ Bn)
TABLE 25 Europe Industrial Gas Turbines Market, by Technology, 2016-2028 (US$ Bn)
TABLE 26 Europe Industrial Gas Turbines Market, by Application, 2016-2028 (US$ Bn)
TABLE 27 Europe Industrial Gas Turbines Market, by Country, 2016-2028 (US$ Bn)
TABLE 28 Germany Industrial Gas Turbines Market, by Capacity, 2016-2028 (US$ Bn)
TABLE 29 Germany Industrial Gas Turbines Market, by Product, 2016-2028 (US$ Bn)
TABLE 30 Germany Industrial Gas Turbines Market, by Technology, 2016-2028 (US$ Bn)
TABLE 31 Germany Industrial Gas Turbines Market, by Application, 2016-2028 (US$ Bn)
TABLE 32 France Industrial Gas Turbines Market, by Capacity, 2016-2028 (US$ Bn)
TABLE 33 France Industrial Gas Turbines Market, by Product, 2016-2028 (US$ Bn)
TABLE 34 France Industrial Gas Turbines Market, by Technology, 2016-2028 (US$ Bn)
TABLE 35 France Industrial Gas Turbines Market, by Application, 2016-2028 (US$ Bn)
TABLE 36 UK Industrial Gas Turbines Market, by Capacity, 2016-2028 (US$ Bn)
TABLE 37 UK Industrial Gas Turbines Market, by Product, 2016-2028 (US$ Bn)
TABLE 38 UK Industrial Gas Turbines Market, by Technology, 2016-2028 (US$ Bn)
TABLE 39 UK Industrial Gas Turbines Market, by Application, 2016-2028 (US$ Bn)
TABLE 40 Italy Industrial Gas Turbines Market, by Capacity, 2016-2028 (US$ Bn)
TABLE 41 Italy Industrial Gas Turbines Market, by Product, 2016-2028 (US$ Bn)
TABLE 42 Italy Industrial Gas Turbines Market, by Technology, 2016-2028 (US$ Bn)
TABLE 43 Italy Industrial Gas Turbines Market, by Application, 2016-2028 (US$ Bn)
TABLE 44 Spain Industrial Gas Turbines Market, by Capacity, 2016-2028 (US$ Bn)
TABLE 45 Spain Industrial Gas Turbines Market, by Product, 2016-2028 (US$ Bn)
TABLE 46 Spain Industrial Gas Turbines Market, by Technology, 2016-2028 (US$ Bn)
TABLE 47 Spain Industrial Gas Turbines Market, by Application, 2016-2028 (US$ Bn)
TABLE 48 Rest of Europe Industrial Gas Turbines Market, by Capacity, 2016-2028 (US$ Bn)
TABLE 49 Rest of Europe Industrial Gas Turbines Market, by Product, 2016-2028 (US$ Bn)
TABLE 50 Rest of Europe Industrial Gas Turbines Market, by Technology, 2016-2028 (US$ Bn)
TABLE 51 Rest of Europe Industrial Gas Turbines Market, by Application, 2016-2028 (US$ Bn)
TABLE 52 Asia Pacific Industrial Gas Turbines Market, by Capacity, 2016-2028 (US$ Bn)
TABLE 53 Asia Pacific Industrial Gas Turbines Market, by Product, 2016-2028 (US$ Bn)
TABLE 54 Asia Pacific Industrial Gas Turbines Market, by Technology, 2016-2028 (US$ Bn)
TABLE 55 Asia Pacific Industrial Gas Turbines Market, by Application, 2016-2028 (US$ Bn)
TABLE 56 Asia Pacific Industrial Gas Turbines Market, by Country, 2016-2028 (US$ Bn)
TABLE 57 China Industrial Gas Turbines Market, by Capacity, 2016-2028 (US$ Bn)
TABLE 58 China Industrial Gas Turbines Market, by Product, 2016-2028 (US$ Bn)
TABLE 59 China Industrial Gas Turbines Market, by Technology, 2016-2028 (US$ Bn)
TABLE 60 China Industrial Gas Turbines Market, by Application, 2016-2028 (US$ Bn)
TABLE 61 Japan Industrial Gas Turbines Market, by Capacity, 2016-2028 (US$ Bn)
TABLE 62 Japan Industrial Gas Turbines Market, by Product, 2016-2028 (US$ Bn)
TABLE 63 Japan Industrial Gas Turbines Market, by Technology, 2016-2028 (US$ Bn)
TABLE 64 Japan Industrial Gas Turbines Market, by Application, 2016-2028 (US$ Bn)
TABLE 65 India Industrial Gas Turbines Market, by Capacity, 2016-2028 (US$ Bn)
TABLE 66 India Industrial Gas Turbines Market, by Product, 2016-2028 (US$ Bn)
TABLE 67 India Industrial Gas Turbines Market, by Technology, 2016-2028 (US$ Bn)
TABLE 68 India Industrial Gas Turbines Market, by Application, 2016-2028 (US$ Bn)
TABLE 69 South Korea Industrial Gas Turbines Market, by Capacity, 2016-2028 (US$ Bn)
TABLE 70 South Korea Industrial Gas Turbines Market, by Product, 2016-2028 (US$ Bn)
TABLE 71 South Korea Industrial Gas Turbines Market, by Technology, 2016-2028 (US$ Bn)
TABLE 72 South Korea Industrial Gas Turbines Market, by Application, 2016-2028 (US$ Bn)
TABLE 73 South East Asia Industrial Gas Turbines Market, by Capacity, 2016-2028 (US$ Bn)
TABLE 74 South East Asia Industrial Gas Turbines Market, by Product, 2016-2028 (US$ Bn)
TABLE 75 South East Asia Industrial Gas Turbines Market, by Technology, 2016-2028 (US$ Bn)
TABLE 76 South East Asia Industrial Gas Turbines Market, by Application, 2016-2028 (US$ Bn)
TABLE 77 Rest of Asia Pacific Industrial Gas Turbines Market, by Capacity, 2016-2028 (US$ Bn)
TABLE 78 Rest of Asia Pacific Industrial Gas Turbines Market, by Product, 2016-2028 (US$ Bn)
TABLE 79 Rest of Asia Pacific Industrial Gas Turbines Market, by Technology, 2016-2028 (US$ Bn)
TABLE 80 Rest of Asia Pacific Industrial Gas Turbines Market, by Application, 2016-2028 (US$ Bn)
TABLE 81 Latin America Industrial Gas Turbines Market, by Capacity, 2016-2028 (US$ Bn)
TABLE 82 Latin America Industrial Gas Turbines Market, by Product, 2016-2028 (US$ Bn)
TABLE 83 Latin America Industrial Gas Turbines Market, by Technology, 2016-2028 (US$ Bn)
TABLE 84 Latin America Industrial Gas Turbines Market, by Application, 2016-2028 (US$ Bn)
TABLE 85 Latin America Industrial Gas Turbines Market, by Country, 2016-2028 (US$ Bn)
TABLE 86 Brazil Industrial Gas Turbines Market, by Capacity, 2016-2028 (US$ Bn)
TABLE 87 Brazil Industrial Gas Turbines Market, by Product, 2016-2028 (US$ Bn)
TABLE 88 Brazil Industrial Gas Turbines Market, by Technology, 2016-2028 (US$ Bn)
TABLE 89 Brazil Industrial Gas Turbines Market, by Application, 2016-2028 (US$ Bn)
TABLE 90 Mexico Industrial Gas Turbines Market, by Capacity, 2016-2028 (US$ Bn)
TABLE 91 Mexico Industrial Gas Turbines Market, by Product, 2016-2028 (US$ Bn)
TABLE 92 Mexico Industrial Gas Turbines Market, by Technology, 2016-2028 (US$ Bn)
TABLE 93 Mexico Industrial Gas Turbines Market, by Application, 2016-2028 (US$ Bn)
TABLE 94 Rest of Latin America Industrial Gas Turbines Market, by Capacity, 2016-2028 (US$ Bn)
TABLE 95 Rest of Latin America Industrial Gas Turbines Market, by Product, 2016-2028 (US$ Bn)
TABLE 96 Rest of Latin America Industrial Gas Turbines Market, by Technology, 2016-2028 (US$ Bn)
TABLE 97 Rest of Latin America Industrial Gas Turbines Market, by Application, 2016-2028 (US$ Bn)
TABLE 98 Middle East and Africa Industrial Gas Turbines Market, by Capacity, 2016-2028 (US$ Bn)
TABLE 99 Middle East and Africa Industrial Gas Turbines Market, by Product, 2016-2028 (US$ Bn)
TABLE 100 Middle East and Africa Industrial Gas Turbines Market, by Technology, 2016-2028 (US$ Bn)
TABLE 101 Middle East and Africa Industrial Gas Turbines Market, by Application, 2016-2028 (US$ Bn)
TABLE 102 Middle East and Africa Industrial Gas Turbines Market, by Country, 2016-2028 (US$ Bn)
TABLE 103 GCC Countries Industrial Gas Turbines Market, by Capacity, 2016-2028 (US$ Bn)
TABLE 104 GCC Countries Industrial Gas Turbines Market, by Product, 2016-2028 (US$ Bn)
TABLE 105 GCC Countries Industrial Gas Turbines Market, by Technology, 2016-2028 (US$ Bn)
TABLE 106 GCC Countries Industrial Gas Turbines Market, by Application, 2016-2028 (US$ Bn)
TABLE 107 South Africa Industrial Gas Turbines Market, by Capacity, 2016-2028 (US$ Bn)
TABLE 108 South Africa Industrial Gas Turbines Market, by Product, 2016-2028 (US$ Bn)
TABLE 109 South Africa Industrial Gas Turbines Market, by Technology, 2016-2028 (US$ Bn)
TABLE 110 South Africa Industrial Gas Turbines Market, by Application, 2016-2028 (US$ Bn)
TABLE 111 Rest of Middle East and Africa Industrial Gas Turbines Market, by Capacity, 2016-2028 (US$ Bn)
TABLE 112 Rest of Middle East and Africa Industrial Gas Turbines Market, by Product, 2016-2028 (US$ Bn)
TABLE 113 Rest of Middle East and Africa Industrial Gas Turbines Market, by Technology, 2016-2028 (US$ Bn)
TABLE 114 Rest of Middle East and Africa Industrial Gas Turbines Market, by Application, 2016-2028 (US$ Bn)

Frequently Asked Questions

How has COVID-19 impacted the global industrial gas turbine market?

The industrial gas turbine market also suffered from the COVID-19 pandemic, which resulted in a decline of over 2.2% in revenue generated in 2020.

Which is the leading market for industrial gas turbines market?

The Asia Pacific accounted for the highest share in the global industrial gas turbines market regarding value and volume.

What are the key drivers for the growth of the industrial gas turbine market?

Rapid technological advancements in the energy industry, rising global demand for power, rapid urbanization, increased investment in energy and power projects, and increased shale gas exploration activities are major factors propelling the market growth.

Which is the product’s major industrial gas turbine market segment?

Heavy duty industrial gas turbines had a major share in 2021, with more than 67% of the market revenue share. Besides, the aero-derivative industrial gas turbines are projected to witness the fastest growth.

Which is the major segment in the industrial gas turbine market by application?

Oil & Gas had a major share in the global market in 2021 and is projected to continue its dominance over the forecast period.

Airless Tires Market

Published:
Report ID: 1175

Singapore Electric Vehicle (EV) Market

Published:
Report ID: 35964

Asia Pacific Automotive Infotainment Systems Market

Published:
Report ID: 35958

Peer-To-Peer Electric Vehicle Charging Market

Published:
Report ID: 9059

Japan Tire Market

Published:
Report ID: 32634

Automotive Steel Wheels Market

Published:
Report ID: 35559

Automotive Alloy Wheels Market

Published:
Report ID: 35549

Automotive Active Safety System Market

Published:
Report ID: 35497

Driving Apparel Market

Published:
Report ID: 35443

Automotive Air Filters Market

Published:
Report ID: 16439

Personal Watercraft (PWC) Market

Published:
Report ID: 34935

X-ray Tire Inspection System Market

Published:
Report ID: 9315

Purchase Options

$2999
Delivery Format: Excel.
$4999
Designed for the individual purchaser.
$6999
Users located at a single corporate site or regional office.
$7999
Allowed for unlimited sharing globally within one company.
Smallform of Sample request

Have a question?

User Profile

Don’t settle for less – trust Mitul to help you find the best solution.

Report delivery within 24 to 48 hours

– Other Info –

What people say?-

User Review

I am very impressed with the information in this report. The author clearly did their research when they came up with this product and it has already given me a lot of ideas.

Jana Schmidt
CEDAR CX Technologies

– Connect with us –

Phone

+91 6232 49 3207


support

24/7 Research Support


sales@credenceresearch.com

– Research Methodology –

Going beyond the basics: advanced techniques in research methodology

– Trusted By –

Pepshi, LG, Nestle
Motorola, Honeywell, Johnson and johnson
LG Chem, SIEMENS, Pfizer
Unilever, Samsonite, QIAGEN