Market Overview:
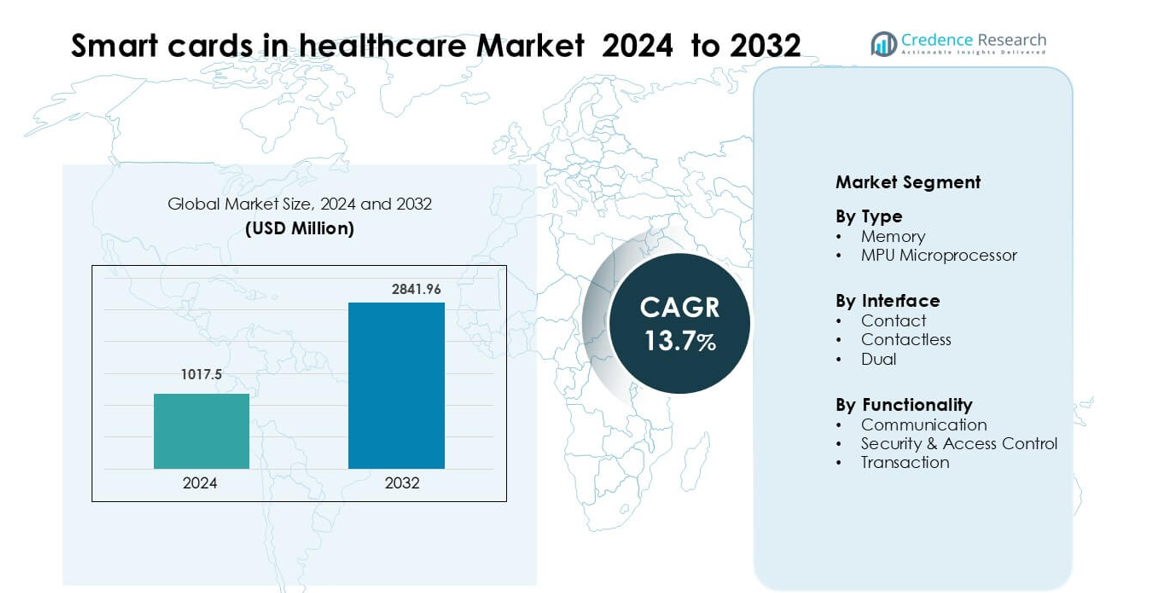
Smart cards in healthcare Market was valued at USD 1017.5 million in 2024 and is anticipated to reach USD 2841.96 million by 2032, growing at a CAGR of 13.7 % during the forecast period.
| REPORT ATTRIBUTE |
DETAILS |
| Historical Period |
2020-2023 |
| Base Year |
2024 |
| Forecast Period |
2025-2032 |
| Smart Cards in Healthcare Market Size 2024 |
USD 1017.5 million |
| Smart Cards in Healthcare Market, CAGR |
13.7% |
| Smart Cards in Healthcare Market Size 2032 |
USD 2841.96 million |
Top players in the Smart Cards in Healthcare Market include IDEMIA, HID, Infineon, Giesecke+Devrient, Ingenico, CPI Card, Eastcompeace, INTELIGENSA, CardLogicx, and BrilliantTS, each focusing on secure authentication, encrypted data handling, and multi-application support for hospital and insurance workflows. These companies strengthen competitiveness through advanced microprocessor technology, dual-interface capabilities, and compliance-driven security solutions. North America leads the global market with about 38% share in 2024, supported by strong EHR adoption, strict data-protection policies, and high investment in digital-health infrastructure across hospitals, clinics, and insurance networks.
Market Insights
- Smart cards in healthcare Market was valued at USD 1017.5 million in 2024 and is anticipated to reach USD 2841.96 million by 2032, growing at a CAGR of 13.7 % during the forecast period.
- Growth stems from the rising need for secure patient identification, government initiatives promoting digital health, and the expanding use of smart cards for EHR access and insurance verification.
- Key trends include increasing deployment of contactless and dual-interface smart cards (the contactless segment held over 28% share in 2020) and strong adoption of microcontroller-based cards (over 55% share in 2020).
- High deployment costs and legacy system-integration challenges hinder adoption, especially in smaller clinics and developing regions.
- Europe held the largest share at over 30% in 2020; Asia-Pacific is expected to record the fastest growth and may become the largest region by 2028.
Access crucial information at unmatched prices!
Request your sample report today & start making informed decisions powered by Credence Research Inc.!
Download Sample
Market Segmentation Analysis:
By Type
Memory smart cards dominate this segment with about 54% share in 2024 because hospitals use these cards for fast data storage, patient identification, and routine record updates. Healthcare providers prefer memory-based cards due to low cost, wide compatibility, and simpler integration with existing hospital information systems. MPU microprocessor cards grow steadily as clinics adopt stronger encryption and multi-application support for e-prescriptions, insurance claims, and clinical data exchange. Rising digital-health programs and secure patient-data handling continue to support broader use across major healthcare networks.
- For instance, Gemalto (now part of Thales) was awarded a contract to supply 35 million microprocessor-based e-health cards in Germany, as part of a national program covering 80 million patients.
By Interface
Contact smart cards lead this segment with nearly 51% share in 2024 as hospitals rely on these cards for secure point-of-care authentication and controlled system access. Clinics choose contact cards because they deliver reliable physical verification and lower error rates during patient check-ins and medical record retrieval. Contactless cards expand quickly as large facilities adopt faster tap-based workflows for emergency rooms and pharmacy counters. Dual-interface cards also gain traction as care providers shift toward unified solutions that support both physical and wireless authentication.
- For instance, Thales’ SafeNet IDPrime 940 contact card has been deployed in several European hospitals and supports CC EAL5+ certification, offering a robust, tamper-resistant credential for clinical desktops.
By Functionality
Security and access control dominate this segment with around 46% share in 2024 due to rising demand for strict staff authentication, controlled drug-dispensing systems, and secure patient-data access under regulatory frameworks. Hospitals implement these cards to reduce unauthorized system entry and protect sensitive clinical information across digital networks. Communication-based cards advance as telehealth, remote monitoring, and digital identity programs grow. Transaction-focused cards also gain use in insurance validation and billing processes as healthcare systems standardize electronic claim approvals and patient service payments.
Key Growth Drivers
Growing Need for Secure Patient Identification
Healthcare systems adopt smart cards to improve patient identification and prevent medical errors. Providers use these cards to authenticate individuals during registration, diagnostics, and treatment, which reduces duplicate records and strengthens data accuracy. Hospitals rely on embedded chips to store core medical details, allergy alerts, and past treatments, enabling faster clinical decisions. Rising data breaches in healthcare push facilities to choose secure card-based verification over manual checks. Governments also support standardized smart ID programs to unify patient databases across clinics. These factors drive strong adoption and highlight the importance of secure, traceable patient identity management in modern healthcare.
- For instance, according to a 2021 OECD survey that included a comparison to 2016 data, only three countries (Denmark, Sweden, and the UK-Scotland) reported full coverage of electronic medical records (eMRs) across all covered healthcare settings in 2016″. The survey also noted that, as of 2021, only 15 out of 27 responding countries had a nationally unified EHR system.
Rising Digital Health Adoption and EHR Integration
Smart cards help hospitals streamline digital workflows by supporting electronic health record access, prescription validation, and insurance authentication. Clinicians use these cards to retrieve complete patient data within seconds, which improves care quality and reduces administrative delays. Growing digital-health investments push providers to integrate smart card systems with telehealth, e-prescription, and remote-monitoring platforms. Countries advancing nationwide EHR programs adopt card-based identification to strengthen interoperability and reduce manual data entry. This growth accelerates card deployment in primary care, emergency units, pharmacies, and insurance offices. Strong alignment with digital transformation keeps this driver significant across global markets.
- For instance, G+D’s smart health cards are used in Germany’s telematics infrastructure (TI) to enable secure access to the elektronische Patientenakte (ePA), their national electronic patient record system. Giesecke+Devrient.
Stricter Regulatory Focus on Data Privacy and Access Control
Healthcare regulations emphasize patient-data protection, driving demand for secure authentication tools. Smart cards support encrypted access control, role-based authorization, and audit tracking, which align with privacy rules in hospitals and labs. Providers use these cards to restrict system access for staff, ensuring only authorized personnel view clinical records, diagnostic reports, or drug inventories. Compliance with data security norms leads many hospitals to replace legacy ID systems with multi-layer authentication cards. The rise in cyberattacks on healthcare infrastructure increases pressure to adopt secure card-based systems. These elements position regulatory compliance as a core growth driver for market expansion.
Key Trends and Opportunities
Expansion of Contactless and Dual-Interface Technologies
Hospitals shift toward contactless and dual-interface smart cards to speed up authentication and reduce touch-based processes. Emergency rooms use these cards for rapid identity checks, enabling faster triage and treatment. Dual-interface cards support both tap-and-go and physical chip reading, helping clinics maintain operational flexibility. Larger facilities adopt wireless authentication to reduce queues at registration counters and pharmacies. This trend aligns with broader digital-health expansion and makes smart cards essential in fast-paced healthcare environments. Growing demand for quick workflows continues to push this transition.
- For instance, Thales’ SafeNet IDPrime 3940 is a dual-interface card (ISO 14443 contactless + contact) with Common Criteria EAL5+ / PP Java-Card certification, enabling both NFC taps and chip reads from the same card.
Integration with Insurance, Billing, and Telehealth Ecosystems
Smart cards connect clinical data with insurance details, billing records, and telehealth platforms, creating end-to-end digital continuity. Patients use these cards for cashless claims, service verification, and remote consultations. Providers integrate cards with online portals to simplify payment validation and reduce documentation errors. Insurers adopt smart card systems to control fraud and verify service usage. Growing telehealth adoption strengthens this trend, as digital identity becomes essential for secure remote care. This integrated environment supports wider use across clinics, pharmacies, and digital-care networks.
- For instance, Taiwan’s National Health Insurance (NHI) smart card system covers over 23 million citizens and links medical data with insurance eligibility, billing history, and e-prescription services, enabling seamless reimbursement across all contracted hospitals and clinics.
Key Challenges
High Deployment and Infrastructure Costs
Hospitals face significant upfront costs when installing smart card systems, including card readers, authentication software, and IT upgrades. Smaller clinics struggle with budget limitations, delaying technology adoption. Integrating cards with EHR systems or insurance databases also requires technical support and training. These expenses slow rollout, especially in developing regions. Providers may prioritize other digital investments before implementing smart card infrastructure. Cost-sensitive environments remain a major challenge for widespread adoption.
Interoperability and System Integration Barriers
Smart cards must integrate smoothly with diverse hospital systems, including EHR platforms, pharmacy applications, insurance portals, and laboratory software. Many healthcare facilities still use outdated systems, making integration slow and complex. Lack of standardization across regions creates compatibility gaps, forcing providers to invest in custom solutions. These issues reduce efficiency and increase operational challenges during deployment. Poor interoperability can delay card usage and limit potential benefits in multi-facility networks.
Regional Analysis
North America
North America leads the Smart Cards in Healthcare Market with around 38% share in 2024 driven by strong adoption of EHR systems, secure patient-ID programs, and strict data-protection regulations. Hospitals use smart cards to streamline authentication, reduce medical errors, and strengthen compliance across care facilities. Large health networks deploy contact, contactless, and dual-interface cards to support smooth access control and insurance validation. The United States contributes the most due to advanced digital-health infrastructure and higher investment in cybersecurity. Canada follows with rising use of smart health cards in national identification and telehealth workflows.
Europe
Europe holds nearly 32% share in 2024 due to widespread digital-health initiatives and strong government-led smart card programs. Countries such as Germany, France, and the U.K. use patient health cards for insurance validation, e-prescriptions, and secure clinical authentication. Hospitals adopt dual-interface cards to ensure interoperability across national systems and cross-border care. The region’s mature regulatory framework encourages secure identity management and encrypted access. Growing investments in electronic health records and teleconsultation platforms further strengthen smart card usage across hospitals, pharmacies, and diagnostic centers.
Asia-Pacific
Asia-Pacific accounts for about 22% share in 2024 and shows the fastest growth as countries expand digital-health ecosystems and national patient-ID programs. China, India, Japan, and South Korea invest heavily in smart authentication, insurance integration, and secure hospital workflows. Rapid urban healthcare expansion drives demand for card-based identity management in high-volume facilities. Contactless and dual-interface cards gain momentum as hospitals modernize patient-flow systems. Rising telehealth use and health-insurance digitization continue to push smart card adoption across public and private healthcare networks in the region.
Latin America
Latin America holds roughly 5% share in 2024, supported by growing digitalization efforts in Brazil, Mexico, Chile, and Colombia. Hospitals adopt smart cards to improve patient tracking, reduce administrative errors, and integrate insurance validation. Public healthcare programs explore card-based identity systems to strengthen service transparency and reduce fraud. Although infrastructure gaps remain, expanding investments in hospital information systems and telemedicine accelerate adoption. The region’s shift toward secure data management and electronic records continues to support gradual market growth.
Middle East & Africa
The Middle East & Africa region represents nearly 3% share in 2024, with rising adoption driven by UAE, Saudi Arabia, and South Africa. These countries implement national e-health strategies that include smart ID cards for patient authentication, insurance management, and controlled access to medical data. High-value hospital projects in the Gulf accelerate digital identity integration, while African nations adopt smart cards mainly in urban hospitals. Limited IT infrastructure slows broader deployment, yet increasing digital-health funding and security-focused reforms support steady market expansion.
Market Segmentations
By Type
- Memory
- MPU Microprocessor
By Interface
By Functionality
- Communication
- Security & Access Control
- Transaction
By Geography
- North America
- Europe
- Germany
- France
- U.K.
- Italy
- Spain
- Rest of Europe
- Asia Pacific
- China
- Japan
- India
- South Korea
- South-east Asia
- Rest of Asia Pacific
- Latin America
- Brazil
- Argentina
- Rest of Latin America
- Middle East & Africa
- GCC Countries
- South Africa
- Rest of the Middle East and Africa
Competitive Landscape
The competitive landscape in the Smart Cards in Healthcare Market features leading players such as IDEMIA, HID, Infineon, Giesecke+Devrient, Ingenico, CPI Card, Eastcompeace, INTELIGENSA, CardLogicx, and BrilliantTS. Companies focus on secure authentication, encrypted data storage, and multi-application integration to support hospital workflows, insurance validation, and patient identity management. Many players invest in advanced microprocessor-based cards, biometric pairing, and dual-interface technologies to meet rising demand for faster and safer access control. Partnerships with hospitals, EHR vendors, and health ministry’s strengthen long-term market presence. Vendors also expand production capabilities to address growing adoption in telehealth, pharmacy networks, and national ID programs. Increasing emphasis on cybersecurity, interoperability, and seamless system integration drives continuous innovation across the competitive landscape.
Shape Your Report to Specific Countries or Regions & Enjoy 30% Off!
Key Player Analysis
- IDEMIA
- HID
- Infineon
- Giesecke+Devrient
- Ingenico
- CPI Card
- Eastcompeace
- INTELIGENSA
- CardLogicx
- BrilliantTS
Recent Developments
- In 2024, AIIMS Delhi declared that it will implement a comprehensive smart card system covering all departments, starting April. From that point forward, payments for investigations and procedures will exclusively be facilitated through the AIIMS Smart Card, with the exception of electronic payment methods like UPI, debit cards, and credit cards.
- In June 2023, UC San Diego Health announced that it was developing a SMART insurance card initiative for digitally standardizing and modernizing health insurance cards. This initiative aims to simplify patient check-ins and minimize billing errors, thereby enhancing efficiency in healthcare processes.
- In March 2022, CPI Card Group CPI Card Group launched its Push Provisioning service, enabling tokenization of Mastercard debit and credit cards into mobile wallets such as Google Pay, Apple Pay, and Samsung Pay, strengthening secure contact and contactless smart-card ecosystems used across regulated sectors, including healthcare
Report Coverage
The research report offers an in-depth analysis based on Type, Interface, Functionality and Geography. It details leading market players, providing an overview of their business, product offerings, investments, revenue streams, and key applications. Additionally, the report includes insights into the competitive environment, SWOT analysis, current market trends, as well as the primary drivers and constraints. Furthermore, it discusses various factors that have driven market expansion in recent years. The report also explores market dynamics, regulatory scenarios, and technological advancements that are shaping the industry. It assesses the impact of external factors and global economic changes on market growth. Lastly, it provides strategic recommendations for new entrants and established companies to navigate the complexities of the market.
Future Outlook
- Demand for microprocessor-based smart cards will rise as hospitals strengthen data security.
- Contactless and dual-interface cards will expand due to faster authentication needs.
- Integration with national digital-health ID programs will accelerate adoption.
- Smart cards will support wider EHR interoperability across multi-facility networks.
- Card-based insurance verification will grow as payers reduce fraud and claim delays.
- Hospitals will adopt biometric-linked smart cards for stronger identity protection.
- Telehealth platforms will use smart cards for secure remote-care access.
- Cloud-based authentication systems will improve card management and scalability.
- Emerging markets will adopt smart cards as digital-health infrastructure improves.
- AI-enabled access control and monitoring features will enhance card functionality.


