
Market Overview
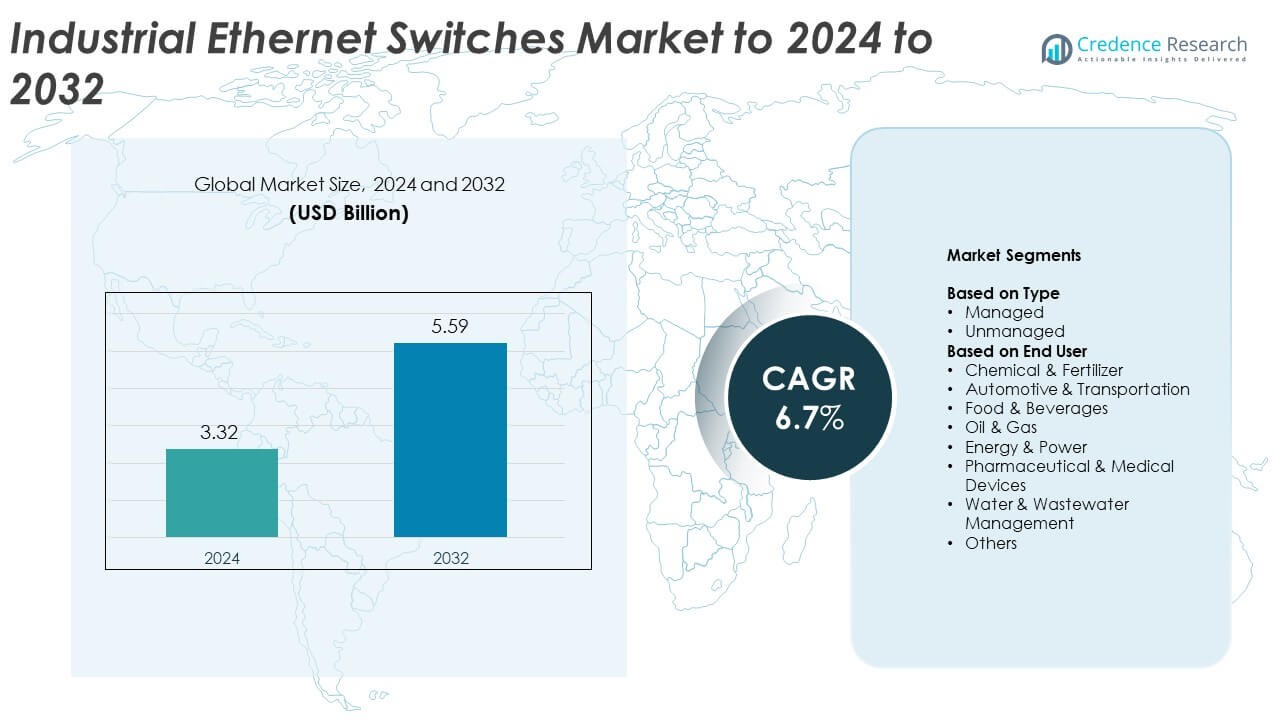
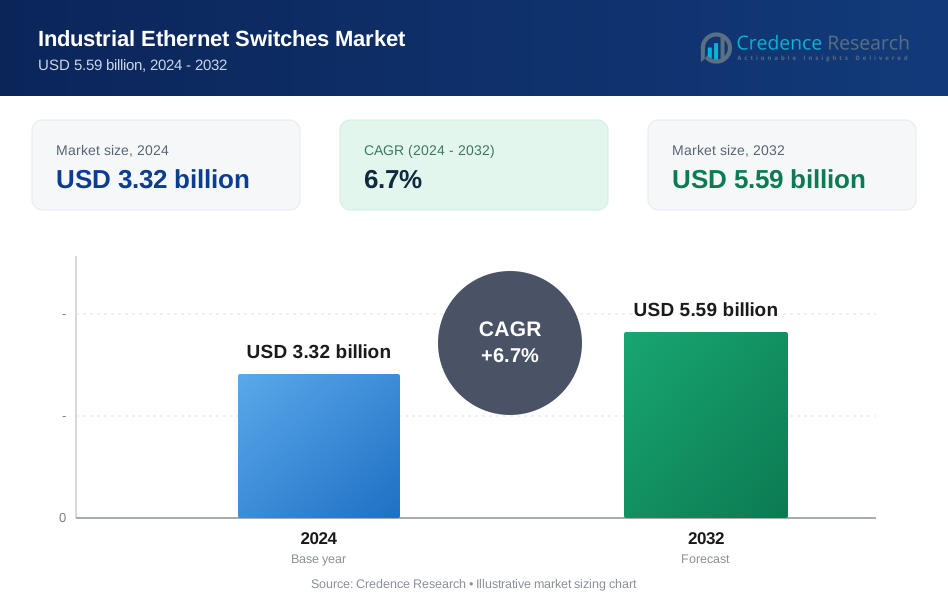
Industrial Ethernet Switches Market size was valued USD 3.32 billion in 2024 and is anticipated to reach USD 5.59 billion by 2032, at a CAGR of 6.7% during the forecast period.
| REPORT ATTRIBUTE | DETAILS |
|---|---|
| Historical Period | 2020-2023 |
| Base Year | 2024 |
| Forecast Period | 2025-2032 |
| Industrial Ethernet Switches Market Size 2024 | USD 3.32 Billion |
| Industrial Ethernet Switches Market, CAGR | 6.7% |
| Industrial Ethernet Switches Market Size 2032 | USD 5.59 Billion |
The Industrial Ethernet Switches Market is shaped by leading players such as Rockwell Automation, Hirschmann Automation and Control GmbH, Cisco Systems, Red Lion Controls, Beckhoff Automation GmbH & Co. KG, Antaira Technologies, Phoenix Contact, Siemens, and GarrettCom (a Belden brand). These companies compete through advanced managed switches, strong cybersecurity features, and rugged designs suited for harsh industrial environments. Their focus on IIoT-ready platforms and Time-Sensitive Networking enhances reliability in automated plants. North America led the market with about 34% share in 2024, followed by Europe at 29% and Asia Pacific at 28%, reflecting strong regional investment in automation and smart manufacturing.
Market Insights
- The Industrial Ethernet Switches Market was valued at USD 3.32 billion in 2024 and is projected to reach USD 5.59 billion by 2032, growing at a CAGR of 6.7%.
- Demand increased due to rising industrial automation and the expansion of IIoT, with managed switches holding about 61% share in 2024.
- Key trends include adoption of smart factory systems, Time-Sensitive Networking, and rugged switches for harsh environments.
- Competition strengthened as major players invested in secure, high-performance switch platforms tailored for robotics, motion control, and large data loads.
- Regional demand was led by North America with 34% share, followed by Europe at 29% and Asia Pacific at 28%, supported by modernization of industrial networks and strong manufacturing activity.
Market Segmentation Analysis:
By Type
Managed switches held the leading position in 2024 with about 61% share of the Industrial Ethernet Switches Market. These switches gained traction because factories needed strong network control, remote diagnostics, and higher security for automated lines. Adoption increased as industries upgraded to Industry 4.0 systems that required VLAN support and real-time monitoring. Unmanaged switches grew in basic installations, yet managed switches stayed dominant due to rising demand for reliable communication in complex industrial environments.
- For instance, Cisco’s Catalyst IE3400 Rugged Series can be expanded to 26 Gigabit Ethernet ports in one managed industrial switch, supporting dense, configurable factory networks.
By End User
Automotive and transportation led the end-user segment in 2024 with nearly 29% share. Automakers expanded connected production lines, which increased demand for industrial Ethernet switches that support robotic welding, assembly, and testing units. Growth came from rising EV manufacturing and digital factories that required high-speed data flow. Other sectors like oil and gas, energy, and water management increased adoption, but the automotive sector remained ahead due to strong investments in automation and predictive maintenance systems.
- For instance, at KUKA Toledo Production Operations, KUKA linked 259 robots and 60,000 other devices/device points with powerful back-end monitoring systems to build Jeep Wrangler body shells.
Key Growth Drivers
Rising Industrial Automation Demand
Industrial automation expanded across factories, which boosted the need for high-speed and reliable networking. Manufacturers adopted automated processes that required stable data transfer between sensors, robots, and control systems. This shift increased the use of Ethernet switches that support real-time communication. Growth accelerated as industries focused on efficiency, reduced downtime, and stronger quality control. The rising deployment of Industry 4.0 systems strengthened demand for switches with advanced monitoring and remote management features.
- For instance, Hyundai Motor Group’s new Ellabell plant in Georgia runs approximately 750 to 850 robots and nearly 300 autonomous guided vehicles alongside approximately 1,400 to 1,450 workers, demonstrating how high automation intensity drives robust networking needs.
Expansion of IIoT and Connected Devices
Industrial IoT adoption increased as plants added more connected equipment. Companies integrated sensors, smart machines, and digital monitoring platforms, which required stable network infrastructure. This trend drove the use of Ethernet switches to manage large data loads and ensure continuous communication. The need for predictive maintenance, asset tracking, and remote operations accelerated switch deployment. Industries relied on secure and scalable networks to support rising IIoT traffic, strengthening market growth.
- For instance, BMW Group’s logistics network handles about 30 million parts per day, which need delivering to the right place at the right time so that around 9,000 new vehicles can be produced daily across the company's global network.
Growing Need for Network Security and Reliability
Industrial operations demanded stronger network protection due to increasing cyber risks. Manufacturers adopted Ethernet switches with advanced security tools that supported encrypted communication and restricted access. This shift helped safeguard automated lines and critical production data. Industries also prioritized network reliability to avoid downtime and production losses. As digitalization increased, companies relied on managed switches to control traffic flow, monitor network health, and maintain stable operations across complex environments.
Key Trends & Opportunities
Shift Toward Smart Factories and Industry 4.0
Smart factory development accelerated as industries implemented AI-driven systems and advanced robotics. These systems required fast and dependable communication, which increased the adoption of Industrial Ethernet switches. Growth also came from digital twins, remote analytics, and machine-to-machine interaction. The shift created opportunities for vendors offering switches with higher bandwidth, low latency, and advanced protocol support. Demand grew as facilities upgraded legacy networks to modern digital frameworks.
- For instance, Siemens’ Electronics Works Amberg produces over 1,200 product variants, records more than 50 million process data points per day, and reconfigures its production line about 350 times daily, reflecting a highly digital smart-factory environment.
Rising Deployment of Rugged and Harsh-Environment Switches
Companies invested in rugged Ethernet switches that operated in extreme temperatures, vibration, and moisture conditions. Growth increased in oil and gas, chemical, mining, and outdoor power applications. These industries needed durable networking hardware to maintain stable performance in challenging environments. Vendors responded with hardened switches that offered extended lifecycles and reliable field connectivity. The trend opened opportunities for specialized switch designs that supported mission-critical operations.
- For instance, Moxa’s EDS-518E managed switch family includes wide-temperature models operating from –40 to 75 degrees Celsius and certified to IEC 61850-3 and IEEE 1613 for substation and heavy-duty environments.
Integration of Time-Sensitive Networking (TSN)
Time-Sensitive Networking gained traction as industries needed predictable communication for automation. TSN-enabled switches improved synchronization between machines and reduced latency in production lines. Adoption increased across robotics, motion control, and high-precision manufacturing. The trend created opportunities for vendors offering TSN-ready solutions that supported advanced industrial protocols. Companies upgraded networks to meet new performance standards, which strengthened demand for modern Ethernet switch platforms.
Key Challenges
High Installation and Upgrade Costs
Industrial Ethernet switch deployment required significant investment, especially in older facilities. Upgrading cables, network layouts, and control systems increased project costs. Smaller manufacturers struggled to adopt advanced managed switches due to budget limits. The high expense slowed adoption in cost-sensitive sectors. Companies evaluated return on investment carefully before modernizing network infrastructure. Cost pressure remained a major barrier, particularly for large-scale automation upgrades.
Complexity in Integrating Legacy Systems
Many plants continued to operate legacy equipment that did not support modern Ethernet protocols. Integrating old systems with new switches created compatibility issues. Industries faced downtime risks during upgrades, which slowed network modernization plans. The process required skilled technicians and careful planning. Difficulties in merging outdated communication systems with advanced networking limited the speed of digital transformation. This challenge became more visible in sectors with long-lifecycle machinery.
Regional Analysis
North America
North America held about 34% share of the Industrial Ethernet Switches Market in 2024. Strong automation adoption across automotive, food processing, and energy facilities supported steady growth. The region expanded smart factory investments, which increased demand for managed switches with advanced control and monitoring features. Rising IIoT implementation and cybersecurity needs also encouraged the use of high-performance network hardware. The United States led due to large manufacturing bases, while Canada advanced digital upgrades in power and utilities. Ongoing transition toward predictive maintenance and connected production systems kept the region in a leading position.
Europe
Europe accounted for nearly 29% share of the Industrial Ethernet Switches Market in 2024. The region benefited from established industrial automation across automotive, machinery, and chemical sectors. Manufacturers accelerated digital transformation under Industry 4.0 programs, which increased demand for secure and reliable Ethernet switches. Germany, the UK, and France deployed advanced robotics and motion-control systems that required low-latency networking. Growth remained stable as plants modernized legacy communication systems and adopted IIoT-ready infrastructure. Sustainability policies and strong investment in smart manufacturing supported continuous adoption across European industries.
Asia Pacific
Asia Pacific dominated with about 28% share of the Industrial Ethernet Switches Market in 2024. Strong production growth in China, Japan, South Korea, and India drove high adoption of industrial networking equipment. Expanding electronics, automotive, and semiconductor industries required fast and scalable communication systems. Governments promoted smart manufacturing, which pushed companies to upgrade networks with managed and rugged switches. Rapid growth of IIoT, robotics, and automated assembly lines strengthened demand. The region’s large industrial base and ongoing factory modernization kept Asia Pacific highly competitive and fast growing.
Latin America
Latin America held roughly 5% share of the Industrial Ethernet Switches Market in 2024. Adoption grew as industries in Brazil, Mexico, and Argentina invested in automation to improve efficiency and reduce operational downtime. Energy, mining, and food processing sectors upgraded their communication networks to support safer and faster production. Limited budgets slowed widespread digitalization, yet modernization of critical facilities sustained steady demand. Growing focus on improving industrial output and meeting global manufacturing standards encouraged companies to adopt advanced network switching solutions.
Middle East and Africa
Middle East and Africa accounted for nearly 4% share of the Industrial Ethernet Switches Market in 2024. Growth came from rising investments in oil and gas, power generation, water treatment, and large-scale industrial projects. Industries upgraded legacy systems to support safer operations and real-time monitoring. Countries in the Gulf region advanced digital industrial programs that required managed switches with stronger reliability. Africa showed gradual growth due to expanding manufacturing bases and infrastructure upgrades. Despite slower adoption compared to other regions, ongoing industrial expansion supported steady switch deployment
Market Segmentations:
By Type
- Managed
- Unmanaged
By End User
- Chemical & Fertilizer
- Automotive & Transportation
- Food & Beverages
- Oil & Gas
- Energy & Power
- Pharmaceutical & Medical Devices
- Water & Wastewater Management
- Others
By Geography
- North America
- U.S.
- Canada
- Mexico
- Europe
- Germany
- France
- U.K.
- Italy
- Spain
- Rest of Europe
- Asia Pacific
- China
- Japan
- India
- South Korea
- South-east Asia
- Rest of Asia Pacific
- Latin America
- Brazil
- Argentina
- Rest of Latin America
- Middle East & Africa
- GCC Countries
- South Africa
- Rest of the Middle East and Africa
Competitive Landscape
The Industrial Ethernet Switches Market features major players such as Rockwell Automation, Hirschmann Automation and Control GmbH, Cisco Systems, Red Lion Controls, Beckhoff Automation GmbH & Co. KG, Antaira Technologies, Phoenix Contact, Siemens, and GarrettCom (a Belden brand). The competitive environment centers on delivering advanced managed switch platforms that support high-speed data transfer, IIoT expansion, and complex automation needs. Companies focus on improving network security, remote diagnostics, and rugged hardware suitable for harsh industrial sites. Product portfolios continue to expand with Time-Sensitive Networking, cloud-enabled management, and cybersecurity features to support smart factory adoption. Vendors strengthen their market positions by enhancing compatibility with major industrial protocols and offering scalable solutions across automotive, energy, chemicals, and water management sectors. Strategic collaborations, capacity expansions, and sustained investment in digital manufacturing technologies further shape competition and drive innovation in modern industrial networking.
Key Player Analysis
- Rockwell Automation
- Hirschmann Automation and Control GmbH
- Cisco Systems
- Red Lion Controls
- Beckhoff Automation GmbH & Co. KG
- Antaira Technologies
- Phoenix Contact
- Siemens
- GarrettCom (a Belden brand)
Recent Developments
- In 2025, Phoenix Contact Launched the FL SWITCH 5900 series, offering managed switches in a 19" format designed for high port density in convergent networks
- In 2025, Antaira announced Firmware V6.2 for all its Ethernet switches, featuring a new web GUI to simplify configuration, reduce setup time, and enhance network uptime with improved security and optimized performance.
- In 2025, Rockwell Automation launched the Stratix 2100 unmanaged industrial Ethernet switch at Automation Fair, featuring improved network reliability via Quality of Service, Energy Efficient Ethernet for cost reduction, and a compact design for panel optimization.
Report Coverage
The research report offers an in-depth analysis based on Type, End-User and Geography. It details leading market players, providing an overview of their business, product offerings, investments, revenue streams, and key applications. Additionally, the report includes insights into the competitive environment, SWOT analysis, current market trends, as well as the primary drivers and constraints. Furthermore, it discusses various factors that have driven market expansion in recent years. The report also explores market dynamics, regulatory scenarios, and technological advancements that are shaping the industry. It assesses the impact of external factors and global economic changes on market growth. Lastly, it provides strategic recommendations for new entrants and established companies to navigate the complexities of the market.
Future Outlook
- Demand for managed switches will rise as factories adopt advanced automation.
- IIoT expansion will increase the need for scalable and secure network infrastructure.
- Smart factory adoption will drive upgrades to high-performance industrial Ethernet systems.
- Time-Sensitive Networking will gain wider use in precision-driven manufacturing.
- Rugged switches will see higher demand in oil, gas, mining, and outdoor industries.
- Cybersecurity features will become a major focus for switch manufacturers.
- Cloud-based monitoring will improve remote management of industrial networks.
- Legacy system replacement will accelerate across aging industrial facilities.
- AI-driven analytics will enhance network optimization and real-time troubleshooting.
- Regional automation programs will strengthen adoption across developing markets.
Request a Free Sample
Fill in your details and we'll send you a free sample report.
- Sample data tables & charts
- Research methodology
Need a Custom Version of This Report?
Tailor the scope, geography, or segments to your exact requirements.
- Custom geography or segment scope
- Direct access to our analyst team
Frequently Asked Questions
What is the current market size for Industrial Ethernet Switches Market, and what is its projected size in 2032?
At what Compound Annual Growth Rate is the Industrial Ethernet Switches Market projected to grow between 2025 and 2032?
Which Industrial Ethernet Switches Market segment held the largest share in 2024?
What are the primary factors fueling the growth of the Industrial Ethernet Switches Market?
Who are the leading companies in the Industrial Ethernet Switches Market?
Which region commanded the largest share of the Industrial Ethernet Switches Market in 2024?
Table of Content
Chapter 1. Report Introduction
- 1.1 Report Description & Purpose
- 1.1.1 Report Title & Market Definition
- 1.1.2 Unique Selling Propositions (USP) & Key Differentiators
- 1.1.3 Value Proposition for Stakeholders
- 1.2 Research Objectives
- 1.2.1 Market Sizing Objectives (Volume & Revenue) (Volume Where Applicable)
- 1.2.2 Segmentation Objectives
- 1.2.3 Competitive Intelligence Objectives
- 1.2.4 Forecast & Scenario Objectives
- 1.3 Report Scope
- 1.3.1 Industrial Ethernet Switches Scope – Segments & Subsegments Covered
- 1.3.2 Geographic Scope – Regions & Countries Covered
- 1.3.3 Historical Period, Base Year & Forecast Period (2024; forecast to 2032)
- 1.3.4 Inclusions & Exclusions
- 1.4 Industry Classification & Applicable Codes
- 1.5 Currency, Measurement Units & Valuation Basis
- 1.6 Target Stakeholders
- 1.7 Limitations & Assumptions
Chapter 2. Executive Summary
- 2.1 Global Industrial Ethernet Switches Market Snapshot
- 2.1.1 Market Size – Historical (2024) & Forecast (2024-2032) (2024: USD 3.32 billion → 2032: USD 5.59 billion)
- 2.1.2 Volume & Revenue – Global Totals (Volume Where Applicable)
- 2.1.3 Key Market Highlights – Top Five Facts
- 2.2 Industrial Ethernet Switches Market Segmentation Snapshot
- 2.2.1 Market Split by Region – 2024 vs. 2032
- 2.3 Competitive Snapshot
- 2.3.1 Top 10 Players by Revenue Share – 2024
- 2.3.2 Top 10 Players by Volume Share – 2024 (Volume Where Applicable)
- 2.3.3 Recent Strategic Developments (18-Month Summary)
- 2.4 Key Investment Highlights & Strategic Conclusions
Chapter 3. Industrial Ethernet Switches Market Dynamics & Industry Analysis
- 3.1 Market Overview & Context
- 3.1.1 Industrial Ethernet Switches Market Position in the Broader Industry Value Chain
- 3.1.2 Demand Structure & Purchasing Dynamics
- 3.1.3 Market Maturity & Development Stage by Region
- 3.2 Industrial Ethernet Switches Market Drivers
- 3.3 Industrial Ethernet Switches Market Restraints & Challenges
- 3.4 Industrial Ethernet Switches Market Opportunities
- 3.5 Porter's Five Forces Analysis
- 3.5.1 Threat of New Entrants
- 3.5.2 Bargaining Power of Suppliers
- 3.5.3 Bargaining Power of Buyers
- 3.5.4 Threat of Substitutes
- 3.5.5 Competitive Rivalry – Intensity Assessment
- 3.6 Industrial Ethernet Switches Value Chain Analysis
- 3.6.1 Upstream – Key Inputs, Resources & Suppliers
- 3.6.1.1 Key Input/Resource 1
- 3.6.1.2 Key Input/Resource 2
- 3.6.1.3 Key Input/Resource 3
- 3.6.2 Midstream – Core Operations & Value Creation
- 3.6.2.1 Operating Model & Process Overview
- 3.6.2.2 Key Operating Locations & Capabilities by Company
- 3.6.3 Downstream – Market Channels & End Users
- 3.6.3.1 Direct Sales & Customer Engagement Channels
- 3.6.3.2 Indirect Sales, Intermediaries & Partner Channels
- 3.6.4 Value Chain Profitability Analysis
- 3.6.1 Upstream – Key Inputs, Resources & Suppliers
- 3.7 PESTEL Analysis
- 3.7.1 Political Factors
- 3.7.2 Economic Factors
- 3.7.3 Social Factors
- 3.7.4 Technological Factors
- 3.7.5 Environmental Factors
- 3.7.6 Legal Factors
- 3.8 Industrial Ethernet Switches Supply Chain Analysis
- 3.8.1 Critical Input & Resource Availability Risk Assessment
- 3.8.2 Supplier & Operational Concentration Risk (Geographic Exposure)
- 3.8.3 Supply & Service Disruption Impact Analysis
- 3.9 Regulatory & Policy Landscape
Note: The regulatory and policy landscape section covers regulations based on their applicability to the market, Industrial Ethernet Switches category, geography, and scope of the study. Only regulatory frameworks with a material impact on operations, compliance, trade, sustainability, or market access are analyzed in detail.
Chapter 4. Key Investment Pockets & Opportunity Analysis
- 4.1 Industrial Ethernet Switches Market Attractiveness Analysis
- 4.1.1 By Region – Investment Attractiveness Matrix (Market Size × CAGR)
- 4.2 Absolute Revenue Growth Opportunity
- 4.2.1 By Region – Absolute Revenue Growth Through 2032
- 4.3 Incremental Demand Opportunity
- 4.3.1 By Region – Incremental Demand Through 2032
- 4.3.2 Segment – Incremental Demand
- 4.4 Emerging Submarket Opportunity Deep Dive (Subject to Applicability)
- 4.5 Priority Market Opportunity Scorecards
- 4.5.1 United States
- 4.5.2 Europe
- 4.5.3 Asia
- 4.5.4 Middle East & Africa
Note: Priority market opportunity scorecards reflect the geographic scope and strategic relevance of the study. Listed markets are indicative and may be adapted to the industry.
Chapter 5. Industrial Ethernet Switches Cross-Border Trade & Market Access Analysis
- 5.1 International Trade & Cross-Border Activity Overview
- 5.1.1 Global Export Value by Country (2024)
- 5.1.2 Global Export Volume by Country (2024) (Volume Where Applicable)
- 5.1.3 Global Import Value by Country (2024)
- 5.1.4 Global Import Volume by Country (2024) (Volume Where Applicable)
- 5.1.5 Net Trade Balance by Country (2024)
- 5.2 Export Analysis – Segment
- 5.2.1 Category 1 (Applicable Classification Code)
- 5.2.2 Category 2 (Applicable Classification Code)
- 5.2.3 Category 3 (Applicable Classification Code)
- 5.2.4 Category 4 (Applicable Classification Code)
- 5.2.5 Category 5 (Applicable Classification Code)
- 5.3 Import Analysis – Segment
- 5.3.1 Category 1 (Applicable Classification Code)
- 5.3.2 Category 2 (Applicable Classification Code)
- 5.3.3 Category 3 (Applicable Classification Code)
- 5.3.4 Category 4 (Applicable Classification Code)
- 5.3.5 Category 5 (Applicable Classification Code)
- 5.4 Cross-Border Pricing & Transaction Benchmarks
- 5.4.1 Export Pricing – Segment & Country
- 5.4.2 Import Pricing – Segment & Source Country
- 5.4.3 Price Trends (2024)
- 5.5 Key Cross-Border Trade & Delivery Routes
- 5.5.1 Cross-Border Trade/Delivery Route 1
- 5.5.2 Cross-Border Trade/Delivery Route 2
- 5.5.3 Cross-Border Trade/Delivery Route 3
- 5.5.4 Cross-Border Trade/Delivery Route 4
- 5.5.5 Cross-Border Trade/Delivery Route 5
- 5.6 Trade Policy & Market Access Impact Assessment
- 5.6.1 Tariff & Non-Tariff Barriers
- 5.6.2 Regional Trade & Economic Integration Frameworks
- 5.6.3 Bilateral & Multilateral Trade Agreements
- 5.6.4 Cross-Border Operating, Licensing & Localization Requirements
Note: This chapter applies where cross-border trade or delivery is relevant to Industrial Ethernet Switches. Goods, services, and digital offerings are assessed using applicable classifications and transaction measures. Import-export volumes, trade balances, and route analyses are included only where meaningful to the market.
Chapter 6. Competitive Landscape & Company Benchmarking
- 6.1 Industrial Ethernet Switches Market Concentration & Structure
- 6.1.1 Herfindahl-Hirschman Index (HHI) – vs. 2024
- 6.1.2 Leading, Mid-Sized & Emerging Player Structure
- 6.1.3 Global, Regional & Local Player Dynamics
- 6.2 Industrial Ethernet Switches Market Share Analysis – 2024
- 6.2.1 Global Revenue Share by Company
- 6.2.2 Global Volume Share by Company (Volume Where Applicable)
- 6.2.3 Regional Revenue Share
- 6.2.4 Market Share Evolution ( vs. 2024)
- 6.2.5 Company Market Share by Key Segment
- 6.2.6 Company Market Share by Customer Group
- 6.3 Operating Scale, Capacity & Infrastructure Analysis
- 6.3.1 Global Operating Scale & Supply Capacity
- 6.3.2 Resource Utilization & Operating Efficiency
- 6.3.3 Output, Service Delivery & Activity Metrics
- 6.3.4 Operating Footprint & Infrastructure Map
- 6.3.5 Planned Operational & Capacity Expansion
- 6.4 Industrial Ethernet Switches Competitive Benchmarking Matrix
- 6.4.1 Revenue, Growth, Profitability & Operating Metric Comparison
- 6.4.2 Channel Revenue Mix
- 6.4.3 Geographic Revenue Exposure
- 6.4.4 R&D Intensity
- 6.4.5 Sustainability Maturity
- 6.5 Strategic Developments in Industrial Ethernet Switches (Last 24 Months)
- 6.5.1 Mergers, Acquisitions & Divestments
- 6.5.2 New Products, Services & Solutions in Industrial Ethernet Switches
- 6.5.3 Operational & Infrastructure Expansions
- 6.5.4 Strategic Alliances, Joint Ventures & Partnerships
- 6.5.5 Distribution Expansion & Market Entry
- 6.5.6 Sustainability & ESG Initiatives
- 6.6 Competitive Strategy Mapping
- 6.6.1 Leader, Challenger, Follower & Niche Classification
- 6.6.2 Pricing Strategy Comparison
- 6.6.3 Channel Strategy Matrix
Note: Strategic developments are included based on their materiality and the availability of reliable information.
Chapter 7. Global Industrial Ethernet Switches Market – By Sales & Delivery Channel
- 7.1 Segment Overview
- 7.1.1 Volume & Revenue Split by Channel (2024 & 2032) (Volume Where Applicable)
- 7.1.2 Channel Mix Evolution (2024-2032)
Chapter 8. Regional Market Analysis – Global Overview
- 8.1 Global Regional Overview
- 8.1.1 Regional Volume Share (Volume Where Applicable)
- 8.1.2 Regional Revenue Share
- 8.1.3 Regional Volume by Region (Volume Where Applicable)
- 8.1.4 Regional Revenue by Region
- 8.1.5 Regional Forecast Through 2032
- 8.2 Cross-Regional Segment Analysis
- 8.2.1 By Sales & Delivery Channel
- 8.2.2 By Competitive Positioning & Price Tier
Chapter 9. North America Industrial Ethernet Switches Market
- 9.1 United States
- 9.2 Canada
- 9.3 Mexico
Chapter 10. Europe Industrial Ethernet Switches Market
- 10.1 Germany
- 10.2 France
- 10.3 Italy
- 10.4 United Kingdom
- 10.5 Spain
- 10.6 Poland
- 10.7 Russia
- 10.8 Netherlands
- 10.9 Belgium
- 10.10 Sweden
- 10.11 Denmark
- 10.12 Norway
- 10.13 Rest of Europe
Chapter 11. Asia Pacific Industrial Ethernet Switches Market
- 11.1 China
- 11.2 India
- 11.3 Japan
- 11.4 South Korea
- 11.5 Thailand
- 11.6 Indonesia
- 11.7 Vietnam
- 11.8 Malaysia
- 11.9 Australia
- 11.10 Rest of Asia Pacific
Chapter 12. Latin America Industrial Ethernet Switches Market
- 12.1 Brazil
- 12.2 Argentina
- 12.3 Colombia
- 12.4 Chile
- 12.5 Rest of Latin America
Chapter 13. Middle East Industrial Ethernet Switches Market
- 13.1 Saudi Arabia
- 13.2 United Arab Emirates
- 13.3 Turkey
- 13.4 Israel
- 13.5 Iran
- 13.6 Rest of the Middle East
Chapter 14. Africa Industrial Ethernet Switches Market
- 14.1 South Africa
- 14.2 Egypt
- 14.3 Nigeria
- 14.4 Morocco
- 14.5 Rest of Africa
Chapter 15. Industrial Ethernet Switches Company Profiles
- 15.1 [Company 01]
- 15.1.1 Company Overview
- 15.1.2 Key Management Personnel
- 15.1.3 Products & Services Portfolio
- 15.1.4 Financial Performance
- 15.1.5 Key Market Focus & Geographic Presence
- 15.1.6 Recent Developments & Strategic Initiatives
Note: The company profile list is preliminary and may change based on research findings, market developments, data availability, and client requirements.
Chapter 16. Appendices
- Appendix A – List of Abbreviations & Acronyms
- Appendix B – Industry Classification Code Reference – Full Series
- Appendix C – Supply, Output & Operating Capacity Data Tables
- Appendix D – End-Use & Demand Base Tables
- Appendix E – Demand, Adoption & Usage Assumptions
- Appendix F – Pricing & Revenue Metric Reference Tables
- Appendix G – Company Operations & Infrastructure Database
- Appendix H – Cross-Border Trade & Activity Data Tables (Where Applicable)
- Appendix I – Regulatory Summary Tables
- Appendix J – Primary Research Participant List (Anonymized)
- Appendix K – Primary Research Questionnaire Framework
- Appendix L – Data Sources & Bibliography
- Appendix M – Market Size Divergence & Source Comparison
Chapter 17. Research Methodology
- 17.1 Research Framework & Philosophy
- 17.2 Secondary Research – Sources, Hierarchy & Data Extraction
- 17.3 Data Modeling – Bottom-Up & Top-Down Market Sizing
- 17.4 Primary Research – Stakeholder Framework, LOI & Sample Sizes
- 17.5 Forecast Methodology – Regression, Scenario & Sensitivity Analysis
- 17.6 Quality Control – Four-Layer Validation Framework
- 17.7 Limitations & Standard Assumptions
- 17.8 Disclaimer
