| REPORT ATTRIBUTE |
DETAILS |
| Historical Period |
2020-2023 |
| Base Year |
2024 |
| Forecast Period |
2025-2032 |
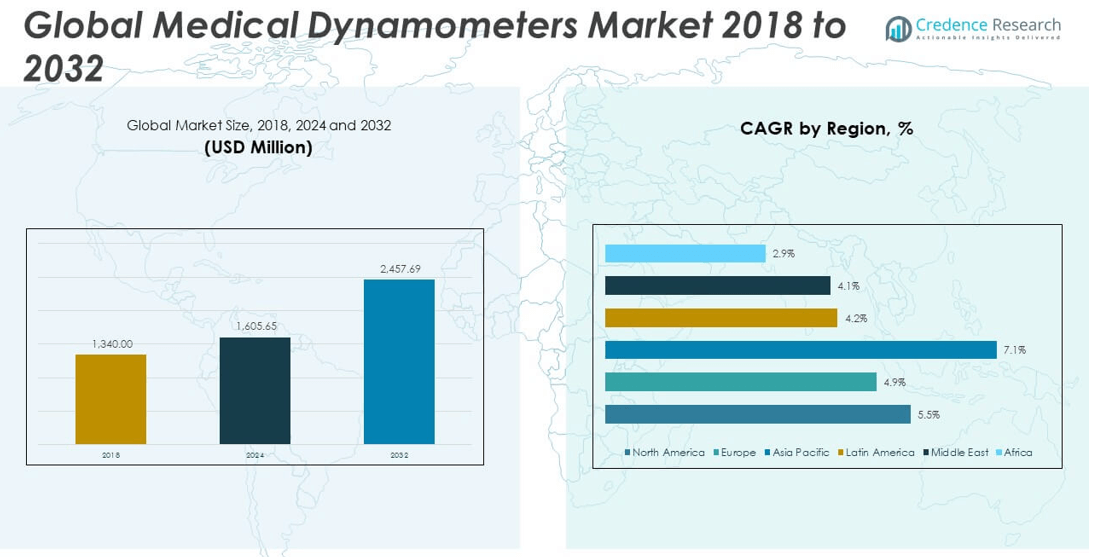
| Medical Dynamometers Market Size 2024 |
USD 1,605.65 million |
| Medical Dynamometers Market, CAGR |
5.50% |
| Medical Dynamometers Market Size 2032 |
USD 2,457.69 million |
Market Overview:
The Medical Dynamometers Market size was valued at USD 1,340.00 million in 2018 to USD 1,605.65 million in 2024 and is anticipated to reach USD 2,457.69 million by 2032, at a CAGR of 5.50% during the forecast period.
The growth of the Medical Dynamometers Market is primarily driven by the rising incidence of musculoskeletal disorders, increasing sports injuries, and a growing elderly population suffering from age-related muscle deterioration. With conditions such as arthritis, osteoporosis, and post-operative rehabilitation becoming more prevalent, healthcare providers are relying heavily on dynamometers to measure muscle strength accurately for diagnosis and therapy planning. Additionally, the increased focus on physical therapy and rehabilitation programs is significantly boosting demand, especially in orthopedic, neurologic, and geriatric care settings. Technological advancements, including the integration of digital sensors, wireless connectivity, and real-time performance tracking, have further enhanced the precision and usability of modern medical dynamometers. These innovations enable seamless data capture, remote patient monitoring, and improved clinical outcomes. Moreover, growing awareness about preventive healthcare and functional fitness, especially among athletes and health-conscious consumers, is encouraging wider adoption of handheld and computerized dynamometers in sports medicine and physical rehabilitation centers.
Regionally, North America dominates the global medical dynamometers market, owing to its advanced healthcare infrastructure, high adoption of rehabilitation technologies, and increasing prevalence of chronic musculoskeletal conditions. The United States, in particular, leads in terms of market share due to the strong presence of key manufacturers, rising healthcare expenditure, and widespread use of dynamometers in both clinical and sports settings. Europe holds the second-largest market share, supported by robust insurance coverage, progressive rehabilitation protocols, and a growing aging population. Countries such as Germany, France, and the United Kingdom are at the forefront of adopting technologically advanced dynamometry devices for routine physiotherapy assessments. Meanwhile, the Asia-Pacific region is witnessing the fastest growth rate, fueled by rapidly expanding healthcare systems, increased investments in physiotherapy services, and rising awareness of physical health and fitness. Latin America and the Middle East & Africa are also gradually gaining momentum as public and private sectors invest in strengthening medical infrastructure and rehabilitation services, paving the way for future market expansion.
Market Insights:
- The Medical Dynamometers Market was valued at USD 1,605.65 million in 2024 and is expected to reach USD 2,457.69 million by 2032, expanding at a CAGR of 5.50%.
- Rising musculoskeletal disorders and the need for post-surgical rehabilitation are driving increased use of dynamometers in orthopedic and long-term care settings.
- The growing elderly population and age-related muscle decline are prompting widespread adoption of grip strength assessments in geriatric care programs.
- Sports medicine clinics and athletic rehabilitation centers are increasing their reliance on medical dynamometers for precise injury recovery and performance monitoring.
- Technological advancements such as Bluetooth connectivity, real-time tracking, and integration with EHR systems are transforming dynamometer usability and accuracy.
- High device costs and limited access in resource-constrained regions remain key barriers, especially where budget limitations and insurance gaps persist.
- North America holds the largest market share due to advanced healthcare infrastructure, while Asia Pacific shows the fastest growth driven by expanding physiotherapy services and rising health awareness.
Access crucial information at unmatched prices!
Request your sample report today & start making informed decisions powered by Credence Research Inc.!
Download Sample
Market Drivers:
Rising Prevalence of Musculoskeletal Disorders and Rehabilitation Needs
Musculoskeletal conditions such as arthritis, lower back pain, and muscle degeneration are increasing worldwide. These disorders significantly impair mobility and require regular strength assessments to guide treatment. The Medical Dynamometers Market benefits from this demand, as clinicians adopt precision tools to monitor progress and design personalized rehabilitation plans. Patients recovering from orthopedic surgeries also need regular strength evaluation, which accelerates product uptake. Hospitals and physiotherapy centers now prioritize evidence-based recovery, driving demand for accurate, handheld dynamometry solutions. It is becoming essential in both acute and long-term care for evaluating therapeutic outcomes.
- For example, the MicroFET2 digital handheld dynamometer, used in over 2,000 U.S. clinics, allows clinicians to quantify muscle strength in Newtons (up to 300 N) and export data for longitudinal tracking.
Growing Geriatric Population and Need for Gait and Grip Strength Assessment
The global elderly population is expanding, leading to a rise in age-related muscle decline and reduced functional ability. Medical dynamometers are used to evaluate grip strength, which is a critical indicator of frailty, fall risk, and overall health status. The Medical Dynamometers Market is gaining traction due to healthcare providers integrating strength testing into geriatric care routines. Early detection of muscle weakness in older adults allows physicians to recommend timely interventions. Public health agencies in developed countries have introduced guidelines encouraging objective strength testing in older patients. It helps clinicians establish baseline metrics and track age-related muscular changes over time.
Increasing Demand from Sports Medicine and Athletic Rehabilitation Facilities
Athletes frequently experience injuries that require precise strength evaluation for safe recovery and return-to-play decisions. Sports medicine professionals and physical therapists rely on dynamometers to assess muscle function and symmetry. The Medical Dynamometers Market sees strong demand from athletic institutions, rehabilitation centers, and performance clinics. These tools help monitor injury recovery, prevent overtraining, and support tailored strength programs. Rising participation in organized sports, fitness activities, and youth athletics contributes to higher usage of dynamometers in sports-focused care. It supports measurable recovery benchmarks and improves injury prevention strategies in competitive and amateur sports environments.
- The Biodex System 4 Pro, for instance, offers isokinetic and isometric strength testing with torque accuracy within ±1% and real-time graphical feedback for athletes.
Advancement in Digital Healthcare Devices and Clinical Integration
The adoption of digital medical devices has transformed patient monitoring and data-driven decision-making in clinical settings. Modern medical dynamometers feature Bluetooth connectivity, touchscreen interfaces, and data storage, enabling seamless integration with electronic health records. The Medical Dynamometers Market is expanding due to demand for intelligent tools that simplify tracking of patient progress over time. Clinics prefer these advanced devices for their ease of use, accuracy, and capacity to generate real-time feedback. Manufacturers continue to invest in product innovation to meet clinician expectations for smart, connected systems. It is increasingly becoming part of routine clinical practice across rehabilitation, geriatrics, and sports care.
Market Trends:
Integration of Artificial Intelligence and Predictive Analytics into Strength Assessment Tools
Medical dynamometry devices are evolving beyond traditional measurement tools by incorporating artificial intelligence (AI) and predictive analytics. These capabilities allow clinicians to generate more precise insights into muscle performance, fatigue trends, and rehabilitation trajectories. The Medical Dynamometers Market is witnessing a shift toward intelligent systems that support clinical decision-making with real-time alerts and treatment suggestions. AI-based systems help track subtle changes in muscle strength over time, improving diagnostic accuracy. Developers are embedding machine learning models to forecast patient outcomes based on grip strength and movement data. It enhances patient monitoring and facilitates early intervention protocols in both hospital and outpatient environments.
Increasing Adoption of Tele-rehabilitation Platforms in Post-Care Monitoring
Tele-rehabilitation is emerging as a mainstream solution in physiotherapy and post-acute care, especially after the global digital health acceleration. Medical dynamometers are now being designed for compatibility with remote care platforms, allowing clinicians to collect strength data from patients at home. The Medical Dynamometers Market is responding to this trend with compact, wireless devices that transmit results to care teams in real-time. Home-based rehabilitation solutions reduce hospital visits and enable more frequent assessments without compromising accuracy. This trend improves continuity of care while enhancing patient compliance with prescribed routines. It aligns with the global shift toward hybrid healthcare models combining in-person and virtual care.
- For example, the Charder Medical MG4800 Wireless Grip Dynamometer supports wireless data transfer via Bluetooth or Wi-Fi, allowing clinicians to track grip strength remotely. It measures grip force up to 130 kg, with interchangeable springs available for different resistance levels (20 kg, 40 kg, 80 kg, and 130 kg). The MG4800 All-Age model features a rechargeable lithium battery with a full recharge time of approximately 2.5 hours.
Rising Demand for Ergonomically Designed and User-Friendly Devices
Product design has become a significant focus area, with manufacturers emphasizing ergonomics and ease of use. Patients across various age groups, including elderly and pediatric populations, require tools that are safe, comfortable, and simple to operate. The Medical Dynamometers Market is seeing increased demand for lightweight, ergonomically shaped devices with intuitive controls. Manufacturers are refining product form factors to reduce user fatigue and improve test accuracy. The emphasis on user experience is influencing purchasing decisions among clinics, hospitals, and rehabilitation centers. It has prompted innovation in both device materials and grip configurations to serve diverse clinical needs.
- For example, the MicroFET2weighs less than a pound and is shaped to fit comfortably in the palm, with strain gauge technology that detects force from multiple angles for precise measurement.
Expansion of Application Scope Beyond Clinical and Sports Settings
Medical dynamometry is extending its utility beyond hospitals and sports medicine into corporate wellness, occupational health, and public health screening. Employers are adopting strength assessment as part of workforce wellness initiatives to reduce injury risk and improve productivity. The Medical Dynamometers Market is benefitting from this diversification, with demand growing in non-traditional healthcare settings. Public health programs use dynamometers to assess community health and identify at-risk individuals through strength-based screenings. Schools and academic institutions are also incorporating basic dynamometry into physical education and fitness assessments. It broadens the user base and reinforces the device’s value in preventive care.
Market Challenges Analysis:
High Device Cost and Limited Access in Low-Resource Settings
The high cost of advanced medical dynamometers limits their adoption in developing countries and small-scale healthcare facilities. Budget constraints often prevent rural hospitals, rehabilitation centers, and community clinics from investing in these specialized diagnostic tools. The Medical Dynamometers Market faces significant barriers in expanding into low-resource regions where demand exists but affordability remains a challenge. Many advanced models with digital interfaces, wireless connectivity, and analytics capabilities are priced beyond the reach of public healthcare providers. Limited insurance coverage for physiotherapy tools further restricts procurement in cost-sensitive markets. It restricts the overall penetration of the technology, delaying widespread adoption across diverse care environments.
Lack of Standardized Protocols and Variability in Measurement Outcomes
The absence of standardized testing protocols across healthcare systems leads to inconsistent assessment and data interpretation. Different healthcare providers may use varied techniques or devices, which complicates clinical benchmarking and comparison of patient outcomes. The Medical Dynamometers Market must address this issue to enhance reliability and support broader clinical adoption. Regulatory guidelines for dynamometry usage remain fragmented, creating uncertainty for both manufacturers and end-users. Training disparities among physiotherapists and clinicians also contribute to variability in results, affecting trust in device accuracy. It impacts the clinical value and scalability of dynamometry solutions in multidisciplinary care models.
Market Opportunities:
Expanding Role in Preventive Healthcare and Community Health Programs
Preventive healthcare is gaining importance globally, with strength testing emerging as a vital indicator of overall health and functional independence. Governments and healthcare organizations are integrating grip strength measurements into routine screenings to identify early signs of frailty and chronic conditions. The Medical Dynamometers Market has a clear opportunity to expand in public health initiatives, school health programs, and geriatric wellness assessments. Devices tailored for high-volume community use, with simplified operation and quick data output, can help scale preventive care infrastructure. It supports broader access to diagnostic tools beyond traditional clinical settings and promotes population-level health management.
Rising Demand from Emerging Markets with Healthcare Infrastructure Growth
Emerging economies are investing in healthcare modernization and rehabilitation services, creating new demand for affordable diagnostic and monitoring devices. The Medical Dynamometers Market can benefit from this shift by offering cost-effective models suited for mid-sized clinics and rural care centers. Local manufacturing partnerships and government-backed procurement initiatives can help lower entry barriers in these regions. It provides device makers with an opportunity to penetrate underserved markets with growing patient volumes. As awareness of muscle strength evaluation increases, the demand for reliable, portable dynamometers is expected to grow across Asia, Latin America, and parts of Africa.
Market Segmentation Analysis:
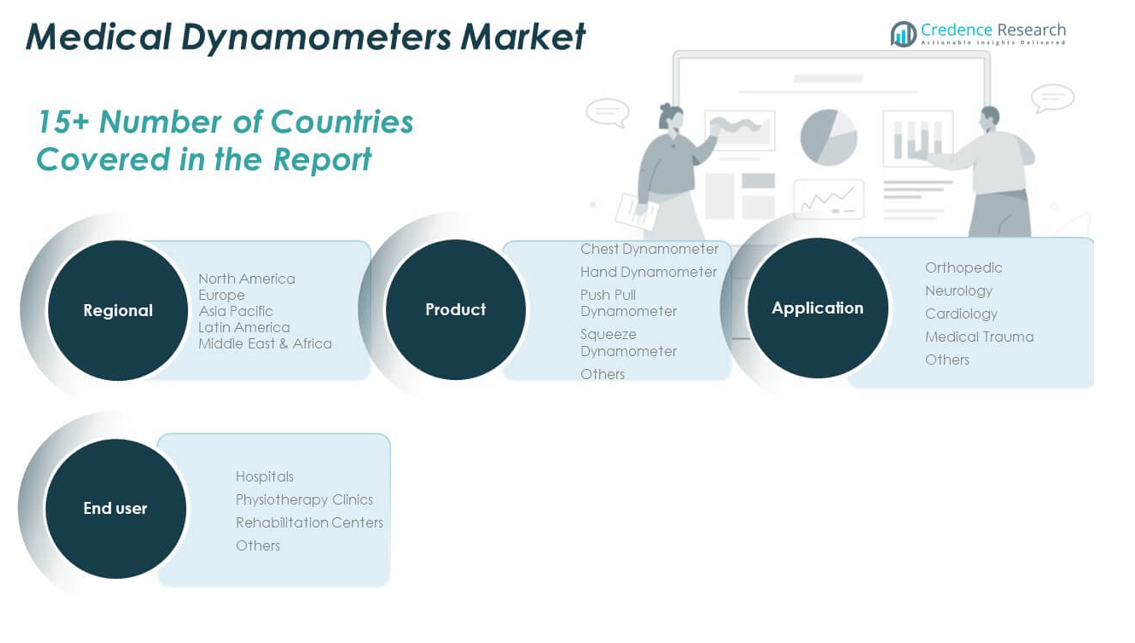
The Medical Dynamometers Market is segmented by product, application, and end user, each contributing uniquely to its growth trajectory.
By product, hand dynamometers dominate the market due to their widespread use in grip strength assessment, particularly in orthopedic and geriatric care. Push pull and squeeze dynamometers are gaining traction in physiotherapy and rehabilitation settings where precise muscle function evaluation is essential. Chest dynamometers are used less frequently but remain relevant in specific diagnostic applications. The “others” category includes emerging or hybrid models designed for niche applications.
- For example, the Jamar Hydraulic Hand Dynamometeris a market leader, extensively used in orthopedic clinics for grip strength assessment in patients with musculoskeletal disorders. It measures grip strength up to 90 kg with high reliability and repeatability, as validated by company datasheets and clinical studies.
By application, orthopedic leads the segment due to the high volume of musculoskeletal disorders requiring strength monitoring. Neurology is another key segment, where dynamometers assist in assessing nerve and muscle function. The cardiology segment utilizes these tools for post-operative rehabilitation, while medical trauma drives demand in emergency and recovery units. The “others” segment includes applications in sports medicine and preventive screening.
By end user, hospitals account for the largest share, supported by high patient volume and advanced infrastructure. Physiotherapy clinics and rehabilitation centers follow closely, driven by demand for continuous muscle strength evaluation. It reflects increasing clinical preference for portable and precise strength measurement tools across various care settings.
- For example, the MicroFET2is favored in outpatient physiotherapy clinics for continuous muscle strength evaluation, with case studies showing improved patient compliance due to its portability and wireless features.
Segmentation:
By Product:
- Chest Dynamometer
- Hand Dynamometer
- Push Pull Dynamometer
- Squeeze Dynamometer
- Others
By Application:
- Orthopedic
- Neurology
- Cardiology
- Medical Trauma
- Others
By End User:
- Hospitals
- Physiotherapy Clinics
- Rehabilitation Centers
- Others
By Region:
- North America
- Europe
- Germany
- France
- U.K.
- Italy
- Spain
- Rest of Europe
- Asia Pacific
- China
- Japan
- India
- South Korea
- South-east Asia
- Rest of Asia Pacific
- Latin America
- Brazil
- Argentina
- Rest of Latin America
- Middle East & Africa
- GCC Countries
- South Africa
- Rest of the Middle East and Africa
Regional Analysis:
North America
The North America Medical Dynamometers Market size was valued at USD 518.58 million in 2018, reached USD 614.31 million in 2024, and is anticipated to reach USD 939.09 million by 2032, at a CAGR of 5.5% during the forecast period. North America holds the largest share of the global market, accounting for 36% of total revenue. The presence of advanced healthcare infrastructure, a high number of rehabilitation centers, and increasing awareness about muscle strength assessment supports strong adoption in this region. The United States remains the dominant contributor due to high healthcare expenditure, insurance coverage, and an aging population. Strong demand from sports medicine and post-operative care also drives market expansion. It continues to benefit from early adoption of digital health tools and integration of dynamometers into physical therapy protocols.
Europe
The Europe Medical Dynamometers Market size was valued at USD 419.42 million in 2018, reached USD 486.15 million in 2024, and is projected to reach USD 709.66 million by 2032, growing at a CAGR of 4.9%. Europe accounts for 29% of the global market, supported by well-established healthcare systems and structured rehabilitation services. Countries such as Germany, France, and the UK are investing in physiotherapy modernization and digital diagnostics. The region emphasizes standardized care, which promotes the use of validated strength assessment tools. Increasing focus on active aging and preventive healthcare creates long-term demand. It is also driven by growing adoption of tele-rehabilitation services in public health systems.
Asia Pacific
The Asia Pacific Medical Dynamometers Market size was valued at USD 265.32 million in 2018, rose to USD 335.33 million in 2024, and is anticipated to reach USD 578.30 million by 2032, at a CAGR of 7.1%. Asia Pacific holds a 21% share of the global market and is the fastest-growing region. Expansion of healthcare infrastructure in China, India, Japan, and Southeast Asia supports widespread adoption. Rising awareness of physical health, increased sports participation, and government support for rehabilitation initiatives strengthen regional demand. It also benefits from rising medical tourism and growing investment in hospital digitization. Market participants are expanding their presence to meet the surge in demand from mid-tier hospitals and private clinics.
Latin America
The Latin America Medical Dynamometers Market size was valued at USD 63.25 million in 2018, reached USD 74.81 million in 2024, and is expected to reach USD 103.40 million by 2032, with a CAGR of 4.2%. Latin America accounts for nearly 5% of the global market, with Brazil and Mexico leading in healthcare development. Growing focus on post-traumatic rehabilitation and sports therapy supports market growth. It gains momentum as public and private hospitals invest in modern diagnostic tools. Adoption remains limited in rural areas, but urban facilities show steady integration of dynamometry into physiotherapy care. The market sees gradual improvement due to medical device import policies and regional distributor expansion.
Middle East
The Middle East Medical Dynamometers Market size was valued at USD 47.70 million in 2018, reached USD 53.30 million in 2024, and is projected to hit USD 73.01 million by 2032, at a CAGR of 4.1%. The region contributes approximately 3% of the global market and shows potential due to rising investment in healthcare infrastructure. Gulf Cooperation Council (GCC) countries, particularly the UAE and Saudi Arabia, lead in terms of adoption. Rehabilitation centers in urban regions are integrating advanced strength testing tools. It is supported by growing demand for orthopedic and geriatric care. Market penetration remains limited in underserved areas, but awareness and accessibility are gradually improving.
Africa
The Africa Medical Dynamometers Market size was valued at USD 25.73 million in 2018, increased to USD 41.75 million in 2024, and is projected to reach USD 54.24 million by 2032, registering a CAGR of 2.9%. Africa holds 2% of the global market and remains in the early stages of adoption. Limited healthcare funding, infrastructure gaps, and high equipment costs restrict widespread use. However, urban hospitals and international aid programs are introducing basic dynamometry tools in clinical settings. It sees pockets of growth in countries like South Africa and Kenya, where rehabilitation services are expanding. Increasing partnerships with NGOs and global suppliers may gradually improve access and affordability.
Shape Your Report to Specific Countries or Regions & Enjoy 30% Off!
Key Player Analysis:
- JLW Instruments
- Marsden Weighing Group
- Charder Electronic
- KERN & SOHN
- Fabrication Enterprises
- JTECH Medical Industries
- Hausmann Industries
Competitive Analysis:
The Medical Dynamometers Market features a moderately consolidated competitive landscape with several key players dominating global sales. Prominent companies include JTECH Medical, Biometrics Ltd., Hausmann Industries, Inc., Fabrication Enterprises, and North Coast Medical. These players focus on expanding their product portfolios with digital, wireless, and ergonomic dynamometers to meet growing clinical demand. It remains competitive through continuous innovation, product upgrades, and integration of data management features. Manufacturers invest in R&D and strategic partnerships to enhance global distribution and comply with regional regulatory standards. Smaller companies and startups are entering the market with cost-effective solutions tailored for emerging economies. Pricing strategies, customer support, and device accuracy continue to influence purchasing decisions across rehabilitation centers, hospitals, and sports medicine facilities. The growing need for personalized care and digital monitoring tools presents opportunities for both established brands and new entrants.
Recent Developments:
- In July 2023, Marsden Weighing Group completed the acquisition of Bailey Instruments, a UK-based manufacturer of surgical instruments. It expands Marsden’s medical device portfolio and strengthens its regional presence in Asia.
Market Concentration & Characteristics:
The Medical Dynamometers Market shows moderate market concentration, with a mix of established global players and emerging regional manufacturers. It is characterized by a strong focus on clinical accuracy, digital integration, and ergonomic design. The market favors companies that offer a wide range of devices for different muscle groups and patient types. Customization, reliability, and compatibility with rehabilitation systems are key differentiators. It caters to both high-end hospital settings and budget-conscious outpatient clinics, driving demand for tiered product offerings. Regulatory compliance and certifications remain critical for market entry and expansion. Technological innovation and after-sales support also influence brand loyalty and market share.
Report Coverage:
The research report offers an in-depth analysis based on product, application, and end user. It details leading market players, providing an overview of their business, product offerings, investments, revenue streams, and key applications. Additionally, the report includes insights into the competitive environment, SWOT analysis, current market trends, as well as the primary drivers and constraints. Furthermore, it discusses various factors that have driven market expansion in recent years. The report also explores market dynamics, regulatory scenarios, and technological advancements that are shaping the industry. It assesses the impact of external factors and global economic changes on market growth. Lastly, it provides strategic recommendations for new entrants and established companies to navigate the complexities of the market.
Future Outlook:
- Rising demand for remote physiotherapy tools will drive innovation in connected, Bluetooth-enabled dynamometers.
- Expansion of geriatric care programs will increase the adoption of grip strength testing devices in primary care.
- Integration with electronic health records will enhance clinical efficiency and streamline patient monitoring.
- Emerging markets will present growth opportunities due to increasing investment in rehabilitation infrastructure.
- Manufacturers will focus on developing cost-effective, portable devices for community health screenings.
- AI-powered analytics will enable predictive insights for personalized therapy and outcome tracking.
- Growing awareness of workplace ergonomics may boost usage in occupational health assessments.
- Pediatric applications will expand with the development of age-specific, user-friendly dynamometers.
- Regulatory bodies may introduce new guidelines standardizing strength measurement in clinical protocols.
- Partnerships with digital health platforms will support broader deployment in hybrid care models.


