
Market Overview
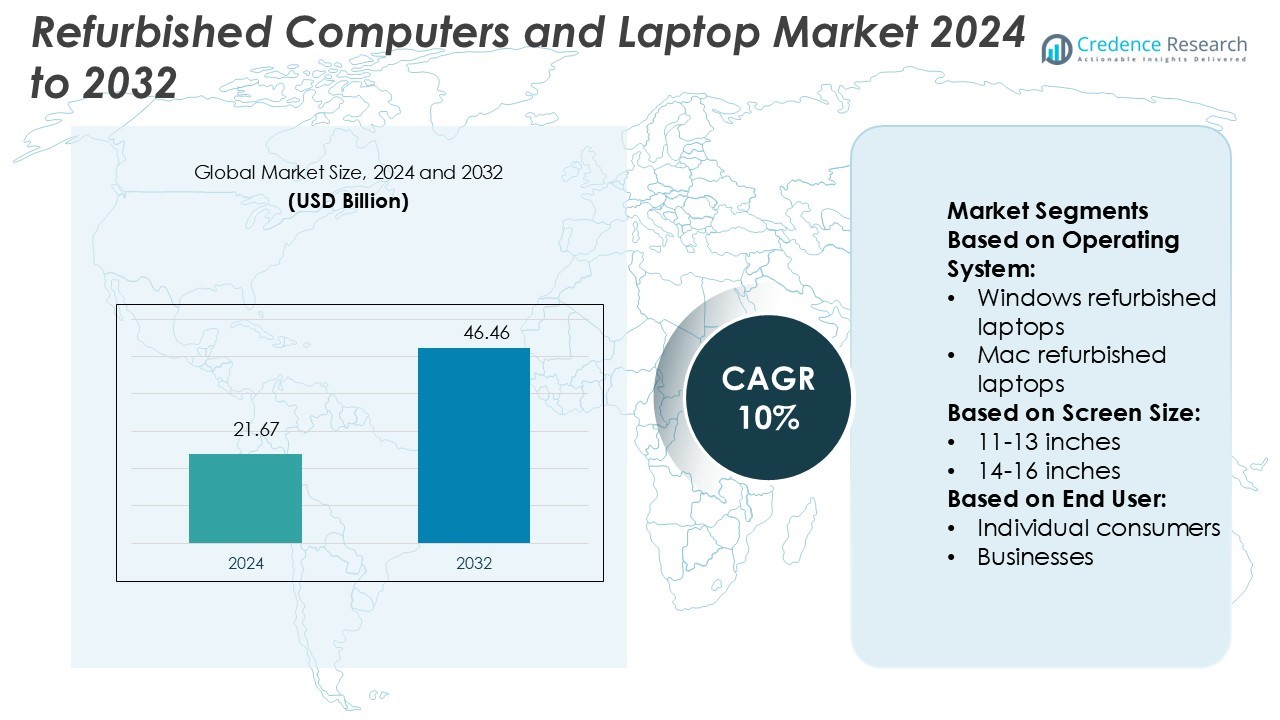
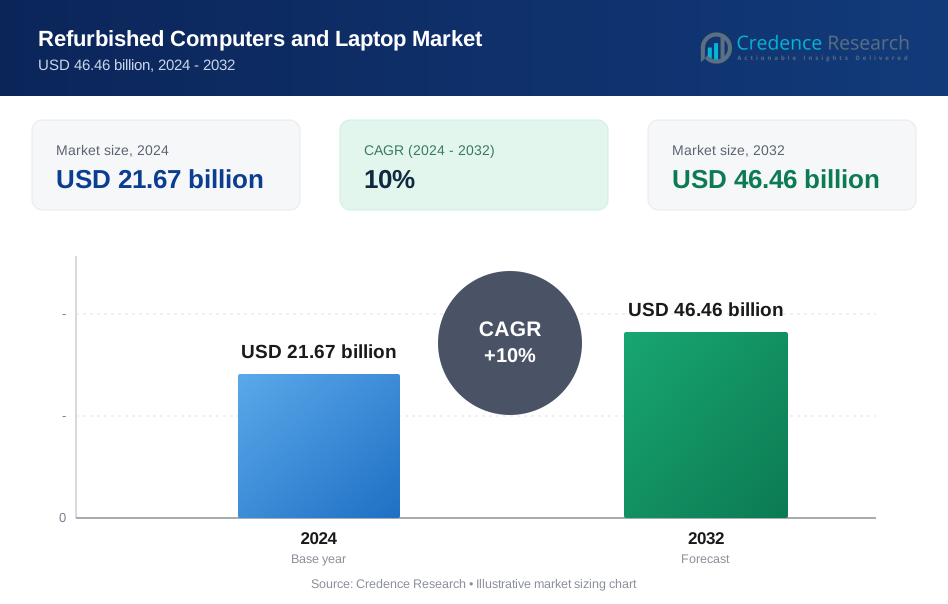
Refurbished Computers and Laptop Market size was valued USD 21.67 billion in 2024 and is anticipated to reach USD 46.46 billion by 2032, at a CAGR of 10% during the forecast period.
| REPORT ATTRIBUTE | DETAILS |
|---|---|
| Historical Period | 2020-2023 |
| Base Year | 2024 |
| Forecast Period | 2025-2032 |
| Refurbished Computers and Laptop Market Size 2024 | USD 21.67 Billion |
| Refurbished Computers and Laptop Market, CAGR | 10% |
| Refurbished Computers and Laptop Market Size 2032 | USD 46.46 Billion |
The refurbished computers and laptop market is driven by leading players including Apple, Dell, Acer, ASUS, Amazon Renewed, Back Market, Best Buy, Gazelle, Arrow Direct, and Blair Tech. These companies strengthen the market by offering certified devices, warranty-backed services, and wide product availability across both consumer and enterprise segments. Global OEMs such as Apple, Dell, Acer, and ASUS focus on manufacturer-certified programs, while platforms like Amazon Renewed and Back Market expand reach through strong e-commerce networks. Specialized refurbishers and retailers enhance competition with value-driven offerings and bulk procurement solutions. Regionally, North America leads the market with a 35% share, supported by strong demand from enterprises, educational institutions, and environmentally conscious consumers.
Market Insights
- The refurbished computers and laptop market was valued at USD 21.67 billion in 2024 and is projected to reach USD 46.46 billion by 2032, registering a CAGR of 10%.
- Growing consumer demand for affordable, certified devices and increasing adoption by enterprises and educational institutions are key drivers boosting market expansion.
- Market trends highlight rising trust in warranty-backed products, expansion of online platforms like Amazon Renewed and Back Market, and the growing role of circular economy initiatives.
- Competition remains strong, with Apple, Dell, Acer, ASUS, Best Buy, Gazelle, Arrow Direct, and Blair Tech competing on quality assurance, price, and after-sales services.
- Regionally, North America leads with a 35% share, followed by Europe at 28% and Asia Pacific at 22%, while the individual consumer segment remains dominant due to increasing affordability and wide product availability.
Market Segmentation Analysis:
By Operating System
Windows refurbished laptops hold the largest share in the refurbished computers and laptop market, accounting for over 60%. Their dominance is supported by strong compatibility with enterprise applications, affordability, and wide consumer familiarity. Businesses prefer Windows systems due to their seamless integration with office software and enterprise solutions, while individuals benefit from broader availability and competitive pricing. Mac refurbished laptops serve a niche segment, favored by creative professionals seeking performance at lower costs. The “Others” category, including Linux-based devices, captures minimal share but is gaining interest among developers and education institutions.
- For instance, Lenovo’s AI-powered refurbishment workflow augmented its diagnostic throughput by 116%, enabling more single-model units to be processed per hour, and achieved 100% on-time fulfillment of refurbished orders.
By Screen Size
The 14–16 inches category leads the market, holding close to 50% share. This dominance comes from its balance of portability and usability, appealing to both professionals and students. Refurbished devices in this size range are widely used by businesses for workforce deployment, supported by durability and performance standards. The 11–13 inches segment caters to highly mobile consumers, such as students and frequent travelers, while 17 inches and above laptops serve specialized use cases like gaming and design, where large displays are critical.
- For instance, Acer Predator Orion 7000 series units include the PredatorSense application, which offers built-in diagnostics that test storage, RAM, and system health.
By End User
Individual consumers form the largest segment, accounting for nearly 55% of the market. High price sensitivity drives demand in this group, as refurbished laptops provide affordable access to premium brands and specifications. Growth in online sales channels further strengthens consumer adoption, making refurbished devices accessible across wider demographics. Businesses follow closely, leveraging refurbished computers to optimize IT budgets and meet sustainability goals. The “Others” segment, including educational institutions and NGOs, also shows rising adoption as part of cost-effective digital transformation strategies.
Key Growth Drivers
Increasing Demand from Cost-Conscious Consumers
The refurbished computers and laptops market is driven by growing adoption among price-sensitive buyers. High-quality refurbished devices provide cost savings of 30–50% compared to new systems, making them attractive for students, small businesses, and households. Economic uncertainties and inflationary pressures further encourage consumers to opt for affordable alternatives. Rising trust in certified refurbishers and warranty-backed products boosts confidence. As more users prioritize functionality over brand-new purchases, the demand for refurbished devices continues to expand, positioning them as a viable option for diverse customer groups.
- For instance, Amazon Renewed requires every refurbished device to pass a full diagnostic test, ensure battery capacity of at least 80% relative to new units, and achieve zero visible defects from a distance of 30 cm.
Sustainability and E-Waste Reduction Initiatives
Growing awareness of environmental concerns significantly drives the refurbished computers and laptops market. Governments and organizations encourage circular economy practices, promoting device reuse to minimize e-waste. By extending product life cycles, refurbished laptops help reduce the carbon footprint of electronic production. Many companies are integrating sustainability goals, sourcing refurbished devices for employees to align with green commitments. Certification standards and recycling regulations further strengthen adoption. Consumers increasingly associate refurbished purchases with responsible consumption, reinforcing market growth while addressing critical global issues like resource conservation and environmental sustainability.
- For instance, Apple has deployed its disassembly robot Daisy, which can disassemble up to 200 iPhone units per hour into precise modules for material recovery. Apple also sources 24 % of the materials in its devices from recycled or renewable sources.
Expansion of Online Sales Channels and Distribution Networks
The rapid growth of e-commerce and dedicated refurbished marketplaces fuels sales expansion. Platforms such as Amazon Renewed, Back Market, and OEM-certified portals provide wide product availability, competitive pricing, and warranty assurance. Online channels offer transparent quality checks and reviews, enhancing customer trust in refurbished systems. Retailers and refurbishers also expand physical distribution networks, including direct partnerships with IT service providers and enterprises. This multichannel approach improves accessibility and supports strong market penetration across both consumer and enterprise segments. The convenience of online browsing combined with secure payment systems accelerates the adoption curve.
Key Trends & Opportunities
Rising Enterprise Adoption for Cost Optimization
Enterprises increasingly integrate refurbished laptops into IT procurement strategies to optimize budgets. Companies save significantly by adopting certified refurbished devices for large teams, especially during hybrid and remote work transitions. Vendors offering bulk supply with extended service packages strengthen corporate adoption. This trend creates strong opportunities for refurbishers to position themselves as strategic IT partners.
- For instance, Samsung operates a Certified Re-Newed program where each device undergoes a 132-point quality inspection, is fitted with a certified new battery, assigned a new IMEI, and must pass functionality tests using 100% genuine Samsung parts.
Integration of Advanced Quality Certification and Warranty Models
Improved grading systems, certifications, and extended warranties enhance the credibility of refurbished devices. Buyers increasingly value assurance of tested components, verified battery life, and manufacturer-backed guarantees. These enhancements open opportunities to capture premium segments, where customers are willing to pay more for certified reliability and long-term performance security.
- For instance, LG increased its recycled plastic usage in products by 36 % year over year, with usage rising from ~54,400 tons in 2023 to ~74,000 tons.
Growing Demand in Emerging Markets
Emerging economies present significant growth opportunities due to affordability needs and rising digital penetration. Government-led digital literacy programs and expanding educational access drive adoption among students. The availability of refurbished laptops at lower costs enables wider access to technology in price-sensitive regions, further accelerating market expansion.
Key Challenges
Consumer Perception and Trust Issues
Despite improvements, refurbished products still face skepticism around quality and durability. Some buyers associate refurbished devices with used or faulty systems. Limited awareness of certification processes and warranty programs further impacts adoption. Overcoming this perception challenge requires consistent education, transparent communication, and robust after-sales support to build long-term trust in refurbished markets.
Supply Chain and Component Availability Constraints
The availability of quality used systems and components often restricts consistent supply. Market fluctuations in IT upgrades or trade-in programs impact refurbishers’ ability to scale operations. Inconsistent component sourcing also affects device standardization, pricing, and turnaround times. Addressing these challenges requires stronger OEM partnerships, structured buy-back schemes, and investment in efficient refurbishment infrastructure to maintain a steady supply chain.
Regional Analysis
North America
North America leads the refurbished computers and laptop market with a 35% share in 2024. Strong demand arises from cost-conscious enterprises and educational institutions that adopt certified refurbished devices to reduce IT expenses. The region benefits from the presence of leading platforms such as Amazon Renewed and Back Market, which offer warranty-backed products. Government initiatives promoting e-waste reduction and sustainability further strengthen adoption. High digital penetration, coupled with increased remote and hybrid work culture, drives steady growth. The United States dominates regional sales, supported by corporate IT upgrades and a rising preference for eco-friendly device consumption.
Europe
Europe accounts for 28% of the refurbished computers and laptop market, supported by strong environmental regulations and sustainability goals. Countries such as Germany, France, and the UK show high adoption, driven by growing trust in certified refurbished devices. The European Union’s circular economy initiatives encourage the reuse of electronics, reducing e-waste and extending device lifecycles. Enterprise buyers and public sector institutions play a major role in demand generation. Well-established refurbishment networks, combined with online marketplaces offering quality assurance, further strengthen market growth. Rising digital transformation across SMEs also contributes to Europe’s robust position in the market.
Asia Pacific
Asia Pacific holds a 22% share in the refurbished computers and laptop market and is the fastest-growing region. Rapid digital adoption, expanding e-learning, and government-led digital literacy initiatives in countries like India, China, and Indonesia fuel demand. The affordability of refurbished laptops makes them attractive to students, households, and small businesses. Growing internet penetration and the rise of e-commerce platforms enhance accessibility. Local refurbishers and global players expand distribution to capture this cost-sensitive market. As the region experiences strong economic growth and increasing technology dependence, the demand for affordable, certified refurbished devices continues to accelerate significantly.
Latin America
Latin America contributes 9% of the refurbished computers and laptop market, with Brazil and Mexico leading adoption. Economic constraints and demand for budget-friendly IT solutions encourage buyers to opt for refurbished devices. Educational programs and small enterprises represent the core customer base. Online marketplaces and retail partnerships expand reach, while warranty-backed products build consumer confidence. Limited awareness and uneven refurbishment infrastructure remain challenges. However, increasing internet penetration and digital inclusion initiatives create growth opportunities. With a growing student population and rising digital economy, Latin America shows potential for further expansion in the refurbished laptop segment.
Middle East & Africa
The Middle East & Africa region holds a 6% share in the refurbished computers and laptop market. Affordability and demand from small businesses and educational institutions drive sales. Countries such as South Africa, the UAE, and Saudi Arabia show rising adoption as digital transformation accelerates. However, limited awareness and weaker refurbishment ecosystems slow wider penetration. E-commerce platforms and regional resellers are expanding their presence, offering certified refurbished devices with warranties to build trust. Government-led digital learning programs and increasing smartphone-to-laptop migration also support growth. The region’s market potential remains strong but requires better infrastructure and consumer education.
Market Segmentations:
By Operating System:
- Windows refurbished laptops
- Mac refurbished laptops
By Screen Size:
- 11-13 inches
- 14-16 inches
By End User:
- Individual consumers
- Businesses
By Geography
- North America
- Europe
- Asia Pacific
- Latin America
- Middle East
- Africa
Competitive Landscape
The refurbished computers and laptop market is shaped by key players such as Best Buy, Gazelle, Apple, Arrow Direct, Acer, Blair Tech, Back Market, ASUS, Amazon Renewed, and Dell. The refurbished computers and laptop market is highly competitive, with players focusing on pricing, quality assurance, and warranty-backed offerings to strengthen customer confidence. Companies differentiate themselves through certified refurbishment processes, advanced testing methods, and after-sales support that ensure performance reliability. The rise of online marketplaces has intensified competition, as wide product availability and transparent customer reviews influence purchasing decisions. Bulk procurement partnerships with enterprises, schools, and government institutions further expand market reach. Sustainability commitments, including reduced e-waste and circular economy practices, also act as key competitive levers. Overall, competition is shaped by affordability, trust-building, and service reliability.
Key Player Analysis
- Best Buy
- Gazelle
- Apple
- Arrow Direct
- Acer
- Blair Tech
- Back Market
- ASUS
- Amazon Renewed
- Dell
Recent Developments
- In October 2024, Honeywell introduced three new handheld computers-CT37, CK67, and CK62-to optimize workflows in warehouses and retail environments. These devices are designed to support Artificial Intelligence (AI) applications, enhancing process efficiency and employee productivity.
- In September 2024, CipherLab Co., Ltd. announced a partnership with Springdel to enhance Mobile Device Management (MDM) solutions for its Android mobile computers. This collaboration aims to improve device monitoring, content delivery, and remote support across various industries, including retail, logistics, and manufacturing.
- In July 2024, Samsung launched its AI-powered laptop, the Galaxy Book4 Ultra, in India. The device is powered by Intel's latest Core Ultra processors, delivering advanced AI capabilities for optimal performance and seamless multitasking. It features a sleek and compact design with a 16-inch Dynamic AMOLED 2X touchscreen display.
- In May 2024, Asus, Microsoft, and Qualcomm collaborated to launch a new generation of AI-powered PCs that promise to revolutionize personal computing. On May 20, ASUS launched a new-era ASUS AI PC at the Next Level AI Incredible virtual launch event. The new PCs offer comprehensive support for the latest AI functionality from Microsoft and ASUS, delivering personalized experiences tailored to individual needs.
Report Coverage
The research report offers an in-depth analysis based on Operating System, Screen Size, End-User and Geography. It details leading market players, providing an overview of their business, product offerings, investments, revenue streams, and key applications. Additionally, the report includes insights into the competitive environment, SWOT analysis, current market trends, as well as the primary drivers and constraints. Furthermore, it discusses various factors that have driven market expansion in recent years. The report also explores market dynamics, regulatory scenarios, and technological advancements that are shaping the industry. It assesses the impact of external factors and global economic changes on market growth. Lastly, it provides strategic recommendations for new entrants and established companies to navigate the complexities of the market.
Future Outlook
- The market will expand as affordability continues to attract individual and enterprise buyers.
- Certified refurbishment programs will gain more trust, driving higher adoption rates worldwide.
- Online marketplaces will play a larger role in distribution and customer engagement.
- Enterprises will increasingly adopt refurbished laptops to optimize IT budgets.
- Growing focus on sustainability will position refurbished devices as eco-friendly alternatives.
- Warranty extensions and service packages will become standard across providers.
- Emerging markets will see rapid adoption due to rising digital penetration.
- Educational institutions will drive bulk demand for cost-effective refurbished devices.
- Supply chain partnerships with OEMs will enhance product quality and availability.
- Consumer awareness campaigns will reduce stigma and strengthen confidence in refurbished products.
Request a Free Sample
Fill in your details and we'll send you a free sample report.
- Sample data tables & charts
- Research methodology
Need a Custom Version of This Report?
Tailor the scope, geography, or segments to your exact requirements.
- Custom geography or segment scope
- Direct access to our analyst team
Frequently Asked Questions
What is the current market size for Refurbished Computers and Laptop Market, and what is its projected size in 2032?
At what Compound Annual Growth Rate is the Refurbished Computers and Laptop Market projected to grow between 2025 and 2032?
Which Refurbished Computers and Laptop Market segment held the largest share in 2024?
What are the primary factors fueling the growth of the Refurbished Computers and Laptop Market?
Who are the leading companies in the Refurbished Computers and Laptop Market?
Which region commanded the largest share of the Refurbished Computers and Laptop Market in 2024?
Table of Content
Chapter 1. Report Introduction
- 1.1 Report Description & Purpose
- 1.1.1 Report Title & Market Definition
- 1.1.2 Unique Selling Propositions (USP) & Key Differentiators
- 1.1.3 Value Proposition for Stakeholders
- 1.2 Research Objectives
- 1.2.1 Market Sizing Objectives (Volume & Revenue) (Volume Where Applicable)
- 1.2.2 Segmentation Objectives
- 1.2.3 Competitive Intelligence Objectives
- 1.2.4 Forecast & Scenario Objectives
- 1.3 Report Scope
- 1.3.1 Refurbished Computers and Laptop Scope – Segments & Subsegments Covered
- 1.3.2 Geographic Scope – Regions & Countries Covered
- 1.3.3 Historical Period, Base Year & Forecast Period (2024; forecast to 2032)
- 1.3.4 Inclusions & Exclusions
- 1.4 Industry Classification & Applicable Codes
- 1.5 Currency, Measurement Units & Valuation Basis
- 1.6 Target Stakeholders
- 1.7 Limitations & Assumptions
Chapter 2. Executive Summary
- 2.1 Global Refurbished Computers and Laptop Market Snapshot
- 2.1.1 Market Size – Historical (2024) & Forecast (2024-2032) (2024: USD 21.67 billion → 2032: USD 46.46 billion)
- 2.1.2 Volume & Revenue – Global Totals (Volume Where Applicable)
- 2.1.3 Key Market Highlights – Top Five Facts
- 2.2 Refurbished Computers and Laptop Market Segmentation Snapshot
- 2.2.1 Market Split by Region – 2024 vs. 2032
- 2.3 Competitive Snapshot
- 2.3.1 Top 10 Players by Revenue Share – 2024
- 2.3.2 Top 10 Players by Volume Share – 2024 (Volume Where Applicable)
- 2.3.3 Recent Strategic Developments (18-Month Summary)
- 2.4 Key Investment Highlights & Strategic Conclusions
Chapter 3. Refurbished Computers and Laptop Market Dynamics & Industry Analysis
- 3.1 Market Overview & Context
- 3.1.1 Refurbished Computers and Laptop Market Position in the Broader Industry Value Chain
- 3.1.2 Demand Structure & Purchasing Dynamics
- 3.1.3 Market Maturity & Development Stage by Region
- 3.2 Refurbished Computers and Laptop Market Drivers
- 3.3 Refurbished Computers and Laptop Market Restraints & Challenges
- 3.4 Refurbished Computers and Laptop Market Opportunities
- 3.5 Porter's Five Forces Analysis
- 3.5.1 Threat of New Entrants
- 3.5.2 Bargaining Power of Suppliers
- 3.5.3 Bargaining Power of Buyers
- 3.5.4 Threat of Substitutes
- 3.5.5 Competitive Rivalry – Intensity Assessment
- 3.6 Refurbished Computers and Laptop Value Chain Analysis
- 3.6.1 Upstream – Key Inputs, Resources & Suppliers
- 3.6.1.1 Key Input/Resource 1
- 3.6.1.2 Key Input/Resource 2
- 3.6.1.3 Key Input/Resource 3
- 3.6.2 Midstream – Core Operations & Value Creation
- 3.6.2.1 Operating Model & Process Overview
- 3.6.2.2 Key Operating Locations & Capabilities by Company
- 3.6.3 Downstream – Market Channels & End Users
- 3.6.3.1 Direct Sales & Customer Engagement Channels
- 3.6.3.2 Indirect Sales, Intermediaries & Partner Channels
- 3.6.4 Value Chain Profitability Analysis
- 3.6.1 Upstream – Key Inputs, Resources & Suppliers
- 3.7 PESTEL Analysis
- 3.7.1 Political Factors
- 3.7.2 Economic Factors
- 3.7.3 Social Factors
- 3.7.4 Technological Factors
- 3.7.5 Environmental Factors
- 3.7.6 Legal Factors
- 3.8 Refurbished Computers and Laptop Supply Chain Analysis
- 3.8.1 Critical Input & Resource Availability Risk Assessment
- 3.8.2 Supplier & Operational Concentration Risk (Geographic Exposure)
- 3.8.3 Supply & Service Disruption Impact Analysis
- 3.9 Regulatory & Policy Landscape
Note: The regulatory and policy landscape section covers regulations based on their applicability to the market, Refurbished Computers and Laptop category, geography, and scope of the study. Only regulatory frameworks with a material impact on operations, compliance, trade, sustainability, or market access are analyzed in detail.
Chapter 4. Key Investment Pockets & Opportunity Analysis
- 4.1 Refurbished Computers and Laptop Market Attractiveness Analysis
- 4.1.1 By Region – Investment Attractiveness Matrix (Market Size × CAGR)
- 4.2 Absolute Revenue Growth Opportunity
- 4.2.1 By Region – Absolute Revenue Growth Through 2032
- 4.3 Incremental Demand Opportunity
- 4.3.1 By Region – Incremental Demand Through 2032
- 4.3.2 Segment – Incremental Demand
- 4.4 Emerging Submarket Opportunity Deep Dive (Subject to Applicability)
- 4.5 Priority Market Opportunity Scorecards
- 4.5.1 United States
- 4.5.2 Europe
- 4.5.3 Asia
- 4.5.4 Middle East & Africa
Note: Priority market opportunity scorecards reflect the geographic scope and strategic relevance of the study. Listed markets are indicative and may be adapted to the industry.
Chapter 5. Refurbished Computers and Laptop Cross-Border Trade & Market Access Analysis
- 5.1 International Trade & Cross-Border Activity Overview
- 5.1.1 Global Export Value by Country (2024)
- 5.1.2 Global Export Volume by Country (2024) (Volume Where Applicable)
- 5.1.3 Global Import Value by Country (2024)
- 5.1.4 Global Import Volume by Country (2024) (Volume Where Applicable)
- 5.1.5 Net Trade Balance by Country (2024)
- 5.2 Export Analysis – Segment
- 5.2.1 Category 1 (Applicable Classification Code)
- 5.2.2 Category 2 (Applicable Classification Code)
- 5.2.3 Category 3 (Applicable Classification Code)
- 5.2.4 Category 4 (Applicable Classification Code)
- 5.2.5 Category 5 (Applicable Classification Code)
- 5.3 Import Analysis – Segment
- 5.3.1 Category 1 (Applicable Classification Code)
- 5.3.2 Category 2 (Applicable Classification Code)
- 5.3.3 Category 3 (Applicable Classification Code)
- 5.3.4 Category 4 (Applicable Classification Code)
- 5.3.5 Category 5 (Applicable Classification Code)
- 5.4 Cross-Border Pricing & Transaction Benchmarks
- 5.4.1 Export Pricing – Segment & Country
- 5.4.2 Import Pricing – Segment & Source Country
- 5.4.3 Price Trends (2024)
- 5.5 Key Cross-Border Trade & Delivery Routes
- 5.5.1 Cross-Border Trade/Delivery Route 1
- 5.5.2 Cross-Border Trade/Delivery Route 2
- 5.5.3 Cross-Border Trade/Delivery Route 3
- 5.5.4 Cross-Border Trade/Delivery Route 4
- 5.5.5 Cross-Border Trade/Delivery Route 5
- 5.6 Trade Policy & Market Access Impact Assessment
- 5.6.1 Tariff & Non-Tariff Barriers
- 5.6.2 Regional Trade & Economic Integration Frameworks
- 5.6.3 Bilateral & Multilateral Trade Agreements
- 5.6.4 Cross-Border Operating, Licensing & Localization Requirements
Note: This chapter applies where cross-border trade or delivery is relevant to Refurbished Computers and Laptop. Goods, services, and digital offerings are assessed using applicable classifications and transaction measures. Import-export volumes, trade balances, and route analyses are included only where meaningful to the market.
Chapter 6. Competitive Landscape & Company Benchmarking
- 6.1 Refurbished Computers and Laptop Market Concentration & Structure
- 6.1.1 Herfindahl-Hirschman Index (HHI) – vs. 2024
- 6.1.2 Leading, Mid-Sized & Emerging Player Structure
- 6.1.3 Global, Regional & Local Player Dynamics
- 6.2 Refurbished Computers and Laptop Market Share Analysis – 2024
- 6.2.1 Global Revenue Share by Company
- 6.2.2 Global Volume Share by Company (Volume Where Applicable)
- 6.2.3 Regional Revenue Share
- 6.2.4 Market Share Evolution ( vs. 2024)
- 6.2.5 Company Market Share by Key Segment
- 6.2.6 Company Market Share by Customer Group
- 6.3 Operating Scale, Capacity & Infrastructure Analysis
- 6.3.1 Global Operating Scale & Supply Capacity
- 6.3.2 Resource Utilization & Operating Efficiency
- 6.3.3 Output, Service Delivery & Activity Metrics
- 6.3.4 Operating Footprint & Infrastructure Map
- 6.3.5 Planned Operational & Capacity Expansion
- 6.4 Refurbished Computers and Laptop Competitive Benchmarking Matrix
- 6.4.1 Revenue, Growth, Profitability & Operating Metric Comparison
- 6.4.2 Channel Revenue Mix
- 6.4.3 Geographic Revenue Exposure
- 6.4.4 R&D Intensity
- 6.4.5 Sustainability Maturity
- 6.5 Strategic Developments in Refurbished Computers and Laptop (Last 24 Months)
- 6.5.1 Mergers, Acquisitions & Divestments
- 6.5.2 New Products, Services & Solutions in Refurbished Computers and Laptop
- 6.5.3 Operational & Infrastructure Expansions
- 6.5.4 Strategic Alliances, Joint Ventures & Partnerships
- 6.5.5 Distribution Expansion & Market Entry
- 6.5.6 Sustainability & ESG Initiatives
- 6.6 Competitive Strategy Mapping
- 6.6.1 Leader, Challenger, Follower & Niche Classification
- 6.6.2 Pricing Strategy Comparison
- 6.6.3 Channel Strategy Matrix
Note: Strategic developments are included based on their materiality and the availability of reliable information.
Chapter 7. Global Refurbished Computers and Laptop Market – By Sales & Delivery Channel
- 7.1 Segment Overview
- 7.1.1 Volume & Revenue Split by Channel (2024 & 2032) (Volume Where Applicable)
- 7.1.2 Channel Mix Evolution (2024-2032)
Chapter 8. Regional Market Analysis – Global Overview
- 8.1 Global Regional Overview
- 8.1.1 Regional Volume Share (Volume Where Applicable)
- 8.1.2 Regional Revenue Share
- 8.1.3 Regional Volume by Region (Volume Where Applicable)
- 8.1.4 Regional Revenue by Region
- 8.1.5 Regional Forecast Through 2032
- 8.2 Cross-Regional Segment Analysis
- 8.2.1 By Sales & Delivery Channel
- 8.2.2 By Competitive Positioning & Price Tier
Chapter 9. North America Refurbished Computers and Laptop Market
- 9.1 United States
- 9.2 Canada
- 9.3 Mexico
Chapter 10. Europe Refurbished Computers and Laptop Market
- 10.1 Germany
- 10.2 France
- 10.3 Italy
- 10.4 United Kingdom
- 10.5 Spain
- 10.6 Poland
- 10.7 Russia
- 10.8 Netherlands
- 10.9 Belgium
- 10.10 Sweden
- 10.11 Denmark
- 10.12 Norway
- 10.13 Rest of Europe
Chapter 11. Asia Pacific Refurbished Computers and Laptop Market
- 11.1 China
- 11.2 India
- 11.3 Japan
- 11.4 South Korea
- 11.5 Thailand
- 11.6 Indonesia
- 11.7 Vietnam
- 11.8 Malaysia
- 11.9 Australia
- 11.10 Rest of Asia Pacific
Chapter 12. Latin America Refurbished Computers and Laptop Market
- 12.1 Brazil
- 12.2 Argentina
- 12.3 Colombia
- 12.4 Chile
- 12.5 Rest of Latin America
Chapter 13. Middle East Refurbished Computers and Laptop Market
- 13.1 Saudi Arabia
- 13.2 United Arab Emirates
- 13.3 Turkey
- 13.4 Israel
- 13.5 Iran
- 13.6 Rest of the Middle East
Chapter 14. Africa Refurbished Computers and Laptop Market
- 14.1 South Africa
- 14.2 Egypt
- 14.3 Nigeria
- 14.4 Morocco
- 14.5 Rest of Africa
Chapter 15. Refurbished Computers and Laptop Company Profiles
- 15.1 [Company 01]
- 15.1.1 Company Overview
- 15.1.2 Key Management Personnel
- 15.1.3 Products & Services Portfolio
- 15.1.4 Financial Performance
- 15.1.5 Key Market Focus & Geographic Presence
- 15.1.6 Recent Developments & Strategic Initiatives
Note: The company profile list is preliminary and may change based on research findings, market developments, data availability, and client requirements.
Chapter 16. Appendices
- Appendix A – List of Abbreviations & Acronyms
- Appendix B – Industry Classification Code Reference – Full Series
- Appendix C – Supply, Output & Operating Capacity Data Tables
- Appendix D – End-Use & Demand Base Tables
- Appendix E – Demand, Adoption & Usage Assumptions
- Appendix F – Pricing & Revenue Metric Reference Tables
- Appendix G – Company Operations & Infrastructure Database
- Appendix H – Cross-Border Trade & Activity Data Tables (Where Applicable)
- Appendix I – Regulatory Summary Tables
- Appendix J – Primary Research Participant List (Anonymized)
- Appendix K – Primary Research Questionnaire Framework
- Appendix L – Data Sources & Bibliography
- Appendix M – Market Size Divergence & Source Comparison
Chapter 17. Research Methodology
- 17.1 Research Framework & Philosophy
- 17.2 Secondary Research – Sources, Hierarchy & Data Extraction
- 17.3 Data Modeling – Bottom-Up & Top-Down Market Sizing
- 17.4 Primary Research – Stakeholder Framework, LOI & Sample Sizes
- 17.5 Forecast Methodology – Regression, Scenario & Sensitivity Analysis
- 17.6 Quality Control – Four-Layer Validation Framework
- 17.7 Limitations & Standard Assumptions
- 17.8 Disclaimer
