Market Overview:
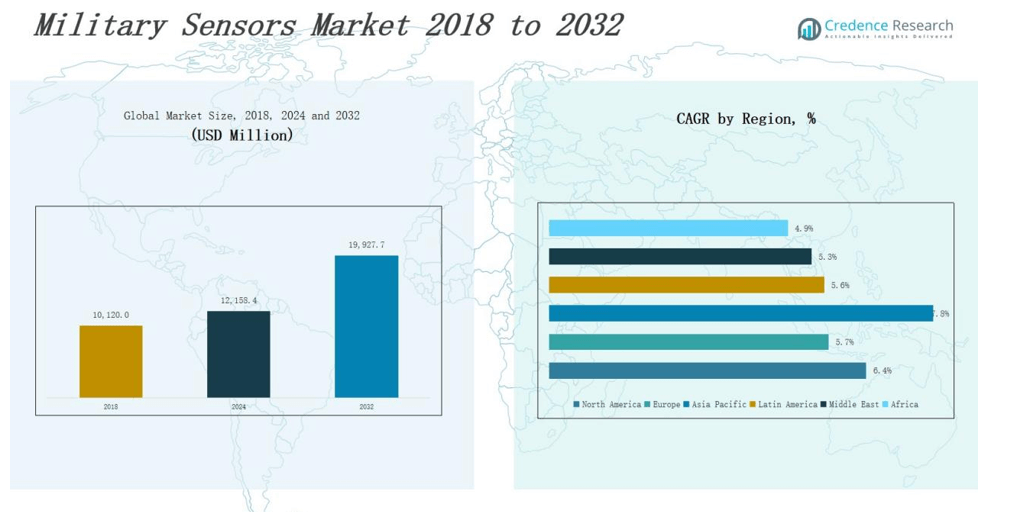
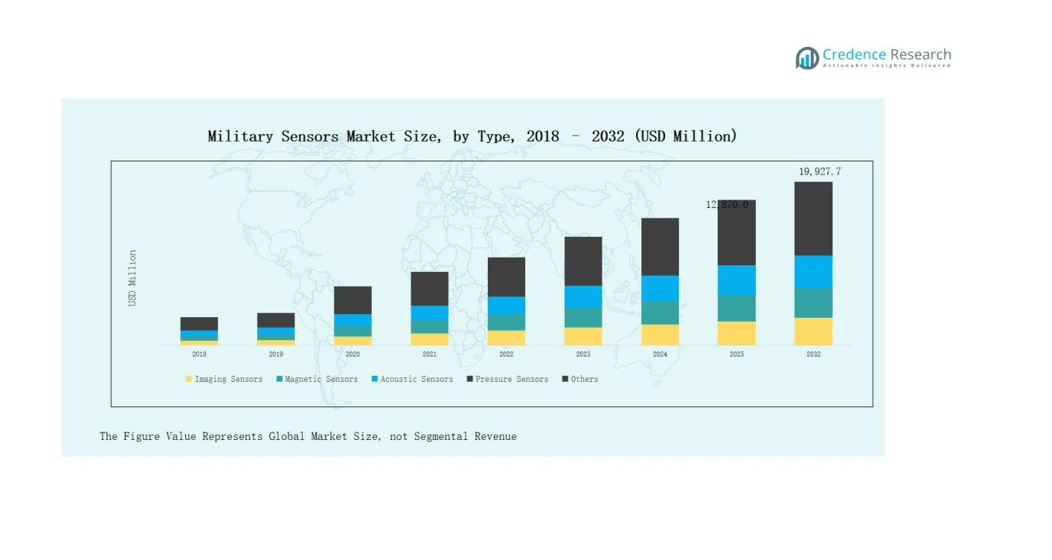
Military Sensors Market size was valued at USD 10,120.0million in 2018 to USD 12,158.4 million in 2024 and is anticipated to reach USD 19,927.7 million by 2032, at a CAGR of 6.4% during the forecast period.
| REPORT ATTRIBUTE |
DETAILS |
| Historical Period |
2020-2023 |
| Base Year |
2024 |
| Forecast Period |
2025-2032 |
| Military Sensors Market Size 2024 |
USD 12,158.4 million |
| Military Sensors Market, CAGR |
6.4% |
| Military Sensors Market Size 2032 |
USD 19,927.7 million |
The Military Sensors Market is shaped by major players such as Lockheed Martin Corporation, Raytheon Technologies Corporation, Northrop Grumman Corporation, Thales Group, BAE Systems, Honeywell International Inc., TE Connectivity, Curtiss-Wright Corporation, General Dynamics Corporation, and L3Harris Technologies Inc. These companies focus on advanced sensor solutions for surveillance, electronic warfare, navigation, and target detection, strengthening their defense portfolios through innovation and strategic contracts. North America leads the market with a 35% share, driven by strong defense budgets, extensive R&D, and large-scale adoption of modern sensor technologies across land, air, and naval platforms.
Market Insights
- The Military Sensors Market grew from USD 10,120.0 million in 2018 to USD 12,158.4 million in 2024 and will reach USD 19,927.7 million by 2032.
- Imaging sensors dominate with 28% share, driven by demand for advanced surveillance, reconnaissance, and AI-enabled multi-spectral technologies in defense modernization programs.
- Intelligence, Surveillance & Reconnaissance (ISR) leads applications with 32% share, supported by rising situational awareness needs, unmanned systems, and real-time battlefield monitoring solutions.
- Airborne platforms hold 39% share, reflecting extensive integration of sensors in UAVs, helicopters, and fighter jets for navigation, ISR, and target recognition functions.
- North America leads with 35% share, followed by Europe at 23% and Asia Pacific at 22%, showcasing strong defense budgets, modernization programs, and rising regional tensions.
Access crucial information at unmatched prices!
Request your sample report today & start making informed decisions powered by Credence Research Inc.!
Download Sample
Market Segment Insights
By Type:
Imaging sensors dominate the military sensors market with a 28% share, supported by rising demand for advanced surveillance, target acquisition, and reconnaissance systems. Their ability to deliver high-resolution data for real-time decision-making has driven adoption across airborne and land platforms. Pressure and acoustic sensors follow, gaining traction in naval applications for underwater detection and monitoring. The shift toward AI-enabled imaging and multi-spectral technologies further strengthens the leadership of imaging sensors in defense modernization programs.
- For instance, Raytheon Technologies has developed advanced acoustic arrays integrated into U.S. Navy’s AN/SQQ-89(V)15 system to enhance submarine detection.
By Application:
Intelligence, Surveillance & Reconnaissance (ISR) leads the application segment with a 32% share, fueled by the increasing need for situational awareness and threat detection across global defense forces. ISR relies heavily on imaging, acoustic, and magnetic sensors to enhance battlefield monitoring and real-time information sharing. Combat operations and electronic warfare represent other fast-growing areas, driven by modernization of combat platforms and electronic countermeasure systems. Expanding investments in unmanned systems have further boosted demand for ISR-related sensor technologies.
- For instance, Northrop Grumman’s RQ-4 Global Hawk employs advanced electro-optical and infrared sensors to deliver high-altitude, long-endurance surveillance for the U.S. Air Force.
By End-Use:
The airborne segment accounts for the largest share of 39%, reflecting extensive integration of sensors in fighter jets, UAVs, and military helicopters. Airborne platforms demand a wide range of sensors for navigation, target recognition, communication, and ISR functions. Land-based systems hold a significant share, supported by increasing deployment of smart armored vehicles and ground-based radar systems. Naval applications continue to expand with growing focus on anti-submarine warfare and shipborne electronic surveillance, creating steady demand for acoustic and pressure sensors.
Market Overview
Rising Demand for ISR Capabilities
The military sensors market grows strongly with rising investments in intelligence, surveillance, and reconnaissance (ISR) systems. Defense forces prioritize real-time battlefield monitoring, target detection, and situational awareness. Imaging, acoustic, and position sensors enable rapid data gathering and precision-based operations. Increasing cross-border tensions and counter-terrorism missions further boost adoption. Governments continue to fund ISR-focused modernization programs, ensuring sustained demand for advanced sensors across land, air, and naval platforms. This push for better visibility in complex environments remains a core growth driver.
- For instance, Elbit Systems’ binocular night vision goggles integrate uncooled thermal sensors, laser range-finders, and digital compasses to provide infantry with heads-up ballistic solutions, enhancing precision in the field.
Modernization of Defense Systems
Ongoing defense modernization programs worldwide significantly drive the market. Militaries are upgrading aircraft, submarines, armored vehicles, and missile systems with advanced sensor technologies. Gyroscopes, magnetic sensors, and proximity sensors are increasingly deployed to enhance accuracy, navigation, and targeting. Countries with higher defense budgets, especially the U.S., China, and European nations, are focusing on next-generation electronic warfare and combat systems. The replacement of legacy equipment with sensor-integrated platforms fuels market expansion, supported by R&D initiatives from global defense contractors.
- For instance, the U.S. Department of Defense integrated Northrop Grumman’s AN/APG-81 AESA radar and advanced navigation sensors into the F-35 Lightning II to improve situational awareness and targeting precision.
Expansion of Unmanned and Autonomous Systems
Growing deployment of unmanned aerial vehicles (UAVs), ground robots, and naval drones accelerates sensor demand. Autonomous systems rely on imaging, gyroscopes, pressure, and proximity sensors for navigation, obstacle detection, and surveillance. Militaries are increasingly using drones for reconnaissance, combat support, and logistics in high-risk environments. This shift reduces soldier exposure to threats while enhancing mission efficiency. Rising focus on autonomous warfare technologies and AI integration strengthens the role of sensors, making them indispensable for future defense strategies.
Key Trends & Opportunities
Integration of AI and IoT in Sensors
The integration of artificial intelligence (AI) and the Internet of Things (IoT) creates new opportunities in the military sensors market. AI-powered algorithms process sensor data rapidly, improving target recognition and threat prediction. IoT-enabled networks link multiple sensors across platforms, enhancing command and control. Defense forces benefit from faster decision-making and better interoperability. This trend supports predictive maintenance and autonomous operations, driving demand for smart, connected sensors in next-generation defense infrastructure.
- For instance, BAE Systems leverages AI in conjunction with IoT sensor platforms to improve autonomous systems used in surveillance and target acquisition, optimizing battlefield responsiveness and reducing human risk.
Rising Focus on Cybersecurity and Electronic Warfare
Electronic warfare and cyber defense are emerging opportunities, as militaries increasingly depend on sensor-driven communication and navigation systems. Sophisticated cyberattacks and electronic jamming have heightened the need for secure, resilient sensors. Companies are investing in anti-jamming technologies and secure data protocols to protect critical missions. With governments prioritizing cybersecurity in defense budgets, demand for robust sensors that can withstand electronic interference continues to grow, opening opportunities for suppliers in advanced warfare solutions.
- For instance, Raytheon Technologies has fielded GPS anti-jam solutions such as Advanced Digital Antenna Production (ADAP), which enables aircraft and precision munitions to maintain navigation accuracy in contested electronic environments.
Key Challenges
High Development and Deployment Costs
The integration of advanced sensors into modern defense systems demands significant investment. High costs associated with R&D, testing, and large-scale deployment often limit adoption in low-budget countries. Even developed nations face budget allocation challenges when balancing between new procurements and upgrades. This cost pressure slows procurement cycles and restricts smaller defense players from competing. Managing affordability while maintaining technological superiority remains a persistent challenge for the market.
Complex Integration with Legacy Systems
Many militaries still operate older platforms that struggle to accommodate advanced sensors. Compatibility issues, technical complexity, and high integration costs hinder smooth deployment. Upgrading older vehicles, aircraft, or naval assets with new technologies requires structural modifications and extended downtime. These barriers delay modernization timelines, reducing operational efficiency. Ensuring seamless integration across mixed fleets of old and new systems is a significant hurdle, particularly in regions with outdated defense infrastructure.
Vulnerability to Electronic Interference
Military sensors, especially those supporting communication and navigation, remain vulnerable to jamming and electronic interference. Adversaries increasingly deploy electronic warfare tactics to disrupt or disable sensor functionality. This poses risks to mission success and compromises battlefield safety. Developing sensors with enhanced anti-jamming capabilities requires high costs and extensive research. The threat of interference remains a critical challenge, pushing companies to innovate resilient technologies that ensure operational continuity under hostile conditions.
Regional Analysis
North America:
North America leads the military sensors market with a 35% share in 2024, driven by high defense budgets and rapid modernization initiatives. The U.S. dominates with extensive investments in ISR systems, electronic warfare, and next-generation combat technologies. The region benefits from strong industrial bases, advanced R&D, and strategic collaborations among leading defense contractors. With revenues growing from USD 3,825.4 million in 2018 to USD 4,542.3 million in 2024, and projected at USD 7,433.6 million by 2032, the region maintains steady momentum with a CAGR of 6.4%.
Europe:
Europe holds a 23% market share in 2024, supported by regional defense cooperation and modernization programs. Countries like the U.K., Germany, and France invest heavily in electronic warfare, ISR, and naval sensor technologies. NATO-driven initiatives and cross-border defense projects create consistent demand. Market size expanded from USD 2,590.7 million in 2018 to USD 2,988.2 million in 2024, with projections of USD 4,618.3 million by 2032 at a CAGR of 5.7%. Strong aerospace and naval industries enhance Europe’s role as a key contributor to sensor integration across diverse platforms.
Asia Pacific:
Asia Pacific accounts for 22% of the market in 2024, making it the fastest-growing region with a CAGR of 7.8%. China, India, Japan, and South Korea are at the forefront, driven by increasing defense budgets, rising geopolitical tensions, and strong naval modernization programs. Regional investments focus on UAVs, communication systems, and surveillance capabilities. The market grew from USD 2,266.9 million in 2018 to USD 2,855.4 million in 2024, and it is expected to reach USD 5,189.8 million by 2032, positioning Asia Pacific as a major growth hub.
Latin America:
Latin America represents a 7% market share in 2024, led by Brazil’s focus on naval and airborne modernization. The region invests gradually in ISR and border security systems, though budget constraints limit large-scale adoption. Market revenues rose from USD 720.5 million in 2018 to USD 858.3 million in 2024, with forecasts of USD 1,316.8 million by 2032, reflecting a CAGR of 5.6%. Despite modest growth, increasing regional security initiatives and modernization of air and naval fleets provide consistent opportunities for sensor deployment.
Middle East:
The Middle East secures a 5% share in 2024, supported by strong investments from GCC countries in surveillance, missile defense, and naval modernization. Regional tensions drive rapid adoption of advanced ISR and combat sensors, with Israel and Turkey also playing vital roles in sensor deployment. The market expanded from USD 455.4 million in 2018 to USD 517.9 million in 2024, projected to hit USD 779.3 million by 2032 at a CAGR of 5.3%. Strategic procurement programs continue to shape demand for advanced sensor technologies.
Africa:
Africa contributes a smaller 3% share in 2024, but shows gradual progress as nations invest in border security and counter-terrorism technologies. South Africa and Egypt remain the key adopters, focusing on ISR and communication systems. Revenues increased from USD 261.1 million in 2018 to USD 396.4 million in 2024, with projections of USD 589.9 million by 2032 at a CAGR of 4.9%. Limited budgets and reliance on imports restrict rapid growth, but expanding security initiatives and modernization plans support future demand.
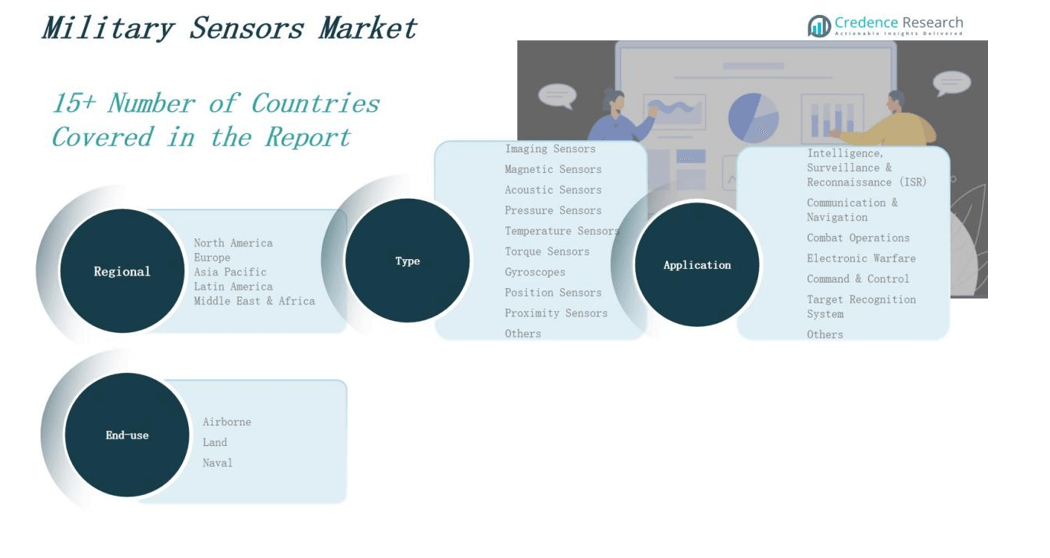
Market Segmentations:
By Type
- Imaging Sensors
- Magnetic Sensors
- Acoustic Sensors
- Pressure Sensors
- Temperature Sensors
- Torque Sensors
- Gyroscopes
- Position Sensors
- Proximity Sensors
- Others
By Application:
- Intelligence, Surveillance & Reconnaissance (ISR)
- Communication & Navigation
- Combat Operations
- Electronic Warfare
- Command & Control
- Target Recognition System
- Others
By End-Use:
By Region
- North America
- Europe
- Germany
- France
- U.K.
- Italy
- Spain
- Rest of Europe
- Asia Pacific
- China
- Japan
- India
- South Korea
- South-east Asia
- Rest of Asia Pacific
- Latin America
- Brazil
- Argentina
- Rest of Latin America
- Middle East & Africa
- GCC Countries
- South Africa
- Rest of the Middle East and Africa
Competitive Landscape
The Military Sensors Market features a competitive landscape dominated by global defense and aerospace companies that prioritize innovation, strategic contracts, and technological integration. Leading players such as Lockheed Martin Corporation, BAE Systems, Northrop Grumman Corporation, RTX Corporation, Honeywell International Inc., Thales Group, Safran S.A., and L3Harris Technologies Inc. focus on enhancing imaging, acoustic, and electronic warfare sensor capabilities to strengthen their defense portfolios. These companies invest heavily in R&D to integrate AI, IoT, and autonomous technologies into advanced sensor systems, ensuring superior situational awareness and operational efficiency. Strategic partnerships with defense agencies, joint ventures, and large-scale government contracts remain central to market dominance. Regional players contribute through specialized sensor technologies tailored to naval, airborne, and land-based applications. Intense competition drives continuous product development, while high entry barriers, regulatory compliance, and cost-intensive R&D limit new entrants. Overall, the market is characterized by consolidation, strong global presence of key players, and increasing emphasis on next-generation sensor innovation.
Shape Your Report to Specific Countries or Regions & Enjoy 30% Off!
Key Players
- Honeywell International Inc.
- Lockheed Martin Corporation
- BAE Systems plc
- L3Harris Technologies, Inc.
- Leonardo S.p.A.
- Teledyne Technologies Incorporated
- Safran S.A.
- Textron Inc.
- Curtiss-Wright Corporation
- TE Connectivity Ltd.
- Thales Group
- General Electric Company
- Crane Aerospace & Electronics
- RTX Corporation
Recent Developments
- In June 2025, TransDigm acquired Simmonds Precision Products for $765 million to strengthen its portfolio in proximity sensing, fuel monitoring, and structural health systems.
- In August 2025, Amphenol announced a $1 billion acquisition of Trexon, a supplier of high-reliability cable assemblies, boosting its defense connectivity and sensor offerings.
- In May 2025, Meta and Anduril partnered to develop advanced wearable sensor devices aimed at U.S. military applications.
- In January 2025, Redwire announced the acquisition of Edge Autonomy for $925 million, expanding its unmanned systems and defense sensor technologies.
Market Concentration & Characteristics
The Military Sensors Market shows moderate to high concentration, with dominance by established global defense contractors that control significant revenue shares. It is characterized by continuous innovation, large-scale government contracts, and high barriers to entry due to heavy R&D costs, long development cycles, and strict regulatory standards. Leading companies focus on expanding sensor capabilities across imaging, acoustic, gyroscopes, and electronic warfare applications, ensuring strong integration into advanced military platforms. It remains highly technology-driven, with emphasis on miniaturization, AI-based data processing, and networked sensor systems that enhance real-time situational awareness. The market benefits from consistent defense modernization initiatives and rising demand for unmanned systems, where sensors play a critical role in navigation and surveillance. Competition fosters alliances, joint ventures, and acquisitions to strengthen product portfolios and geographic reach. It continues to evolve toward multifunctional, resilient, and interoperable sensors, reinforcing its importance in shaping future defense strategies worldwide.
Report Coverage
The research report offers an in-depth analysis based on Type, Application, End Use and Region. It details leading market players, providing an overview of their business, product offerings, investments, revenue streams, and key applications. Additionally, the report includes insights into the competitive environment, SWOT analysis, current market trends, as well as the primary drivers and constraints. Furthermore, it discusses various factors that have driven market expansion in recent years. The report also explores market dynamics, regulatory scenarios, and technological advancements that are shaping the industry. It assesses the impact of external factors and global economic changes on market growth. Lastly, it provides strategic recommendations for new entrants and established companies to navigate the complexities of the market.
Future Outlook
- Advanced ISR capabilities will keep driving adoption of sophisticated military sensors across defense platforms globally.
- Artificial intelligence integration will improve target recognition, predictive analysis, and faster decision-making in military operations.
- Unmanned vehicles and autonomous platforms will increasingly depend on advanced sensors for navigation and surveillance.
- Sensor miniaturization will expand deployment opportunities across land, naval, and airborne defense systems worldwide.
- Rising focus on electronic warfare will increase demand for resilient, interference-resistant, and adaptive military sensors.
- International defense collaborations will create opportunities for sensor technology transfer and joint development initiatives.
- Ongoing modernization programs will accelerate replacement of outdated sensor systems with advanced, multifunctional alternatives.
- Naval modernization will boost adoption of acoustic and pressure sensors for anti-submarine and surveillance operations.
- Growing cybersecurity threats will shape secure, encrypted, and anti-jamming sensor development to ensure mission reliability.
- Industry consolidation through mergers and acquisitions will reinforce the dominance of leading global defense contractors.


